


Journal of Sustainable Cities and Built Environment
Volume 4, Issue 2, 2026, ISSN: 2536-0132

Original Article
Application of Earned Value Analysis in Appraising Rural Development Projects in Ebonyi State of Nigeria
Adeyemi Adedapo Adewale 1*  and Odaudu Ugbede Sunday 2

Editor: Ashraf Mohamed Soliman 

Reviewers:
Abdulaziz Abdulrahman
Zainab Jagun
1* Institute of the Built Environment, School of Postgraduate Studies, Nasarawa State University, Keffi, Nigeria; (Corresponding) moddap@gmail.com
2 Department of Architecture, Faculty of Environmental Sciences, Dennis Osadebay University, Asaba, Nigeria; arcodauduugbede@yahoo.com
Received 20 February 2026, Revised 15 May 2026, Accepted 18 May 2026, Available online 25 May 2026
DOI: https://doi.org/10.58757/jscbe.04.02.02
Abstract:
Long-lasting overruns in costs and timeframes in Nigeria undermine the resilience of infrastructure developments in rural sub-Saharan Africa and it is a threat to the sustainability of built environment assets along the urban-rural range. This paper uses Earned Value Analysis (EVA) to estimate the performance of nine rural development projects in Ebonyi State, Nigeria, quantitatively by determining and ranking governance and management drivers of project success to inform sustainable built environment policy and assist in informing the new discourse on institutional capacity of infrastructure delivery in developing contexts. A sequential explanatory mixed methodology was used. A high level of variation was experienced between road works (mean CPI=0.68) and water schemes (mean CPI=0.78). Infrastructure sustainability in rural Nigeria is pegged on governance and specifically the local authority level. The dysfunctional aspect of the paradoxical negative outcome of monitoring is a sign of systemic malfunction that is bursting of corruption, technical tools deficit and the adoption of ineffective oversight policies. The paper recommended improvement in policy and practise through empowerment of local government in institutions, re-engineering monitoring and evaluation among others.
Keywords: Earned Value Analysis; Rural Infrastructure; Nigeria; Monitoring and Evaluation; Local Government Capacity
- Introduction:
The built environment is not limited to the metropolitan centers, but it incorporates expansive rural areas that constitute the national economies. The disparity between urban and rural infrastructure systems in Nigeria has become a hindrance of unsustainable development towards the realization of the Sustainable Development Goals (SDGs), especially Goal 11, which envisages inclusive, safe, resilient, and sustainable human settlements. The SDG 11 acknowledges the significance of the linkage of urban and rural territories and argues that sustainable cities cannot be disconnected with their rural hinterland [1]. Physical environments such as rural development projects, such as roads, water supply systems, and community centers, are important to promote connectivity, economic performance, and service provision [2], [3]. These projects are always associated with cost and time overruns that affect their long-term strategic significance, destroy the trust of citizens, and waste limited resources [4].
The infrastructure performance and the sustainable development are interconnected in both ways: successful projects provide an opportunity to develop both the economy and society, whereas unsuccessful projects continue to keep the living conditions of people in poverty and inequality. Infrastructural deficit falls primarily on rural residents (especially women and children) who waste hours on the inaccessible roads or gather water in polluted areas [5]. Thus, the ability to explain what issues determine rural infrastructure success is not an empty technical task but a prerequisite to the transformative potential of the SDGs.
Although Earned Value Analysis (EVA) is a relatively ancient quantitative model that incorporates project management scope, schedule, and cost performance [6], its use in the context of Nigerian rural development is in a dire state. Available literature mostly revolves around urban construction/building or a private sector, which introduces a gap in knowledge, on how exactly successes and failures are driven in publicly funded rural infrastructure. Moreover, the connection between standard project control measurements and the sustainability of the built environment resources, in general, is seldom expressed directly.
The African context has little research that has been done on the application of EVA in projects in the public sector, Mwangi [7] used EVA to road construction projects in Kenya and reported the average CPI per project is 0.81 and procurement delays became the leading reason of underperformance. Asare [8] studied water infrastructure projects in Ghana and noted that the increase in the costs (average 24 percent) was often associated with poor project planning and capacity of the contractors. These studies have, however, failed to provide a systematic association of quantitative operational performance with governance determinants with a critical gap in the comprehension of why projects fail, other than technical causes in the short-term.
The correlation between the local government intervention and the project outcomes has been hypothesized in the development literature but few studies have conducted empirical studies using rigorous quantitative approaches. Another level of government, the Local Government Authorities (LGAs), is the level of governance that is closest to the rural community, but their role in the provision of infrastructure is controversial. Those in favour believe that local control will increase accountability and responsiveness [9], whereas those opposed cite capacity limits and political interference as constraining [10]. Nigeria has constitutional clauses that give local governments a substantial level of responsibilities, yet decades of fiscal centralization and political subjection have made many LGAs weak when it comes to administration [11]. The empirical issue of whether and in what circumstances local government intervention enhances the outcomes of a project is not answered. This paper fills this gap through the application of EVA to the poor performing rural projects in Ebonyi State. The specific objectives are:
- The objective of the study is to measure the degree of cost and schedule overruns in terms of EVA metrics given to nine rural infrastructural projects, and project level disaggregation is to be done.
- To determine and list the critical success factors that affect project delivery, especially the variables of governance
- To elaborate on the processes in which monitoring becomes ineffective, a separation between corruption, technical incompetence and lack of policy implementation should be made.
- To develop governance-oriented recommendations to increase the sustainability of rural built environment assets, which has implications to be applied to a large scale in case-based evidence from Ebonyi State and Nigeria.
Project Success in Rural Infrastructure Definitions: One conceptual background that is critical to this study is the operational definition of project success. The conventional project management literature defines success in a very limited definition as completion within time, budgetary and quality constraints, which is the iron triangle [12]. But in the case of rural infrastructure in the developing setting, this definition does not suffice. An otherwise on time and on budget road that is not actually served because of wrong alignment with community needs or a water scheme that is operational only half a year before collapsing because of inability to maintain the scheme cannot be regarded as a success in the sustainable development environment.
Based on frameworks advanced by the World Bank [13] and the African Development Bank [14], this research follows a multi-dimensional definition version of the project success that include:
- Efficiency: Within approved cost and time limits (measured in CPI and SPI).
- Effectiveness: Technical specifications and quality standards are reached (measured using technical audits).3. Sustainability: Have functionality and use of infrastructure resources at least 2 years after completion (user survey).
- Relevance: Adaptation to community priorities and needs (measured by the community engagement indices).
- Institutional influence: Building of local infrastructure management capacity (in terms of stakeholder analysis).
This broad definition is in line with SDG 11, which upholds sustainability and inclusiveness because it appreciates the fact that the success of infrastructure is eventually measured by its ability to lead human development outcomes.
- Literature Review: Theoretical Bases and State of the Art Evidence:
2.1. Earned Value Analysis: Development and Africa Implementation.
Earned Value Analysis developed as a result of industrial engineering practice in the United States in the 1960s to become a standard of project management throughout the world [15]. The technique incorporates three key dimensions of project performance, which are; planned value (budgeted cost of work scheduled), earned value (budgeted cost of work performed), and actual cost (actual cost of work performed). Out of them, two significant indices are obtained:
Cost Performance Index (CPI) = EV/AC… (1)
Schedule Performance Index (SPI) = EV / PV…. (2)
A CPI or SPI that is below 1.0 implies poor results, and the gravity of the deviation will be high by showing the seriousness of overruns [16].
Although EVA has been adopted in numerous projects in the developed countries’ environment, it has limited application in African infrastructure projects. One of the summaries of major research on the continent is provided in Table 1:
Table 1: Earned Value Analysis Projects in the Infrastructure of Africa.
| The Study | Country | Sector | Sample Size | Key Findings | Limitations |
| Mwangi & Were [7] | Kenya | Roads | 12 projects | Mean CPI=0.81, SPI=0.76; procurement and No governance analysis are the primary causes of delays. | No government analysis |
| Asare et al. [8] | Ghana | Water | 8 projects | Mean cost overrun 24; planning deficiencies were determined Small sample, no regression | No regression analysis performed |
| Nkado & Meyer [17] | South Africa | Buildings | 25 projects | CPI range 0.65-1.12; contractor capacity critical Urban focus only. | Urban focusing only, limiting genralization |
| [Olawale & Sun [18] | Nigeria | Mixed | 15 projects | 78% had >20% project overruns; funding constraint was the main constraint | No EVA used |
| Tengan & Aigbavboa [19] | Ghana | Rural roads | 6 projects | Averages SPI=0.72; monitoring practices were found to be in-effective | Qualitative only; no quantitative EVA metrics |
| Present study | Nigeria | Rural | 9 projects | CPI mean 0.72 CPI SPI 0.68; governance factor correlate strongly(0.45) with project outcomes | Regional coverage. |
No external source or prior publication contains this exact table; it was created specifically for this manuscript by compiling and summarising findings from the listed references. Therefore, the table should be cited as “Source: Authors’ compilation based on [7], [8], [17], [18], [19] and primary data. “All these studies prove that African infrastructure delivery is simply disease-ridden with cost and schedule overruns of about 20-35 normally. Nevertheless, all of them have failed to offer any systematic associations of EVA measures with the determinants of governance using a thorough statistical model, which is a major gap that this study has filled.
2.2. Governance and Infrastructure Performance:
The theory of governance and infrastructure outcomes relationship is supported by several complementary models. The concept of the agency theory [20] represents the infrastructure projects as a contract between the principal (government, citizens) and the agents (contractors, project managers). Asymmetry of information and divergent interest mean that there is a chance of opportunistic behavior, and it requires monitoring and alignment of incentives. Nevertheless, the agency problem is exacerbated when the strength or weakness of the institutions themselves in turn become weak or captured.
The institutional theory [21] stipulates that any project performance is embedded in a wider institutional context of both formal and informal restrictions (laws, regulations and norms, practices). In informal institutions are weak, project implementation can be guided by informal institutions, such as patronage, corruption, and ethnic favoritism [22]. This theoretical lens determines why the same methods of project management domain will deliver varying results in various institutional settings.
Tiered governance theory [23] is a theory that looks at the roles that are played by different levels of government. The infrastructure delivery in federal systems such as Nigeria has complicated relationship among the federal, state and local governments. The best division of tasks rests on the subsidiarity principle the functions are to be performed at the lowest level that can accomplish their work properly. Proximity and capability tensions between the proximity and ability are, however, often created by capacity constraints at local levels, which require greater involvement at higher levels.
2.3. Local Government Involvement and project outcomes Empirical evidence
There is mixed empirical evidence on the relationship between the involvement of the local government and the outcome of the project in developing countries. The decentralization give reference to the following:
- India: Research of rural road construction established that projects constructed by elected local councils were 15-20 percent lower in cost and quality rating than centrally constructed projects [24], [ 25].
- Uganda: Water infrastructure decentralization advanced the outcome of maintenance as it enhanced community responsibility [26].
- Indonesia: The presence of local government in infrastructure planning made the projects relevant and more satisfying to the community [27].
Conversely, critics point to:
- Kenya: The lack of strong international capacity in the country led to a slow implementation process and quality loss where responsibilities were devolved [28].
- Zambia: Local level political capture shifted infrastructure funds to politically affiliated groups [29].
- Nigeria: Local governments are financially subject to the state and federal transfers, which lead to a lack of accountability and incentives to rent seek [11]. Precisely in Nigeria, [30] investigated the roles of funds in rural development projects and established that the main constraint was the late availability of funds by the higher government, whether it included the local government or not. Their analysis was, however, not done in a systematic comparison of the outcomes of the governance contexts.
The second chapter is the Monitoring Paradox: Why Monitoring Fails. Monitoring is regarded as a positive control role and its presence improves the performance that is universally postulated by standard project management literature [16, 31]. Nevertheless, developing markets also record more and more cases of ineffectiveness of monitoring or even its counter-effect. To find out what causes monitoring to fail, one needs to investigate a variety of causal mechanisms.
2.4. Corruption and Capture
In case of monitoring institutions where corruptions exist, monitoring becomes a rent seeking position instead of a performance enhancement mechanism. The patterns of monitoring in Nigeria have been reported through studies on inspection in which the inspector involves taking a bribe to certify work of poor quality [32, 33]. The heightening of the intensity of monitoring of this kind will get more extortionate demands and even worse results since contractors will redirect the resources towards bribing instead of quality materials. [34] found that only 23% of M&E officers in South-East Nigerian states had formal training in project management methodologies, compared to 68% in South-West states with stronger institutional histories.
2.4.1. Technical Capacity Shortcomings.
The efficient monitoring will imply technical expertise in the project management tools and techniques, including EVA itself. Nonetheless, the research of the Nigerian public sector surveillance agencies shows that they are characterized by extreme capacity limitations: an insignificant minority of the monitoring officials underwent theoretical preparation on implementing modern approaches to project control [35] In the event of lack of such capacity, monitoring activities yield unreliable information and fallacious advice, which may deflect attention on actual performance problems.
2.4.2. Temporal Misalignment
Monitoring that is carried out too late in the lifecycle of the project will not be able to shape the corrective action. In the Nigerian public sector, the relationship between project completion and the issuance of monitoring visits is rather common, or after the issues have turned irreversible [36]. This ex-post facto approach is what relegates monitoring to a formative improvement exercise into a fault-finding exercise of no productive use.
2.4.3. Compliance Orientation
In cases where monitoring is based solely on the procedural adherence instead of the actual performance, this will motivate the behaviors that will damage the performance. Contractors can value documentation and paperwork than quality workmanship because they are aware that monitoring systems only ensure the first factor is present but not the second [37]. Such mimicry which takes the shape of the system of functioning, is especially common in the scenarios, where international donors require that procedures must be tracked without being adjusted to the local conditions.
2.4.4. Political Interference
Results that are found to pose risks to the political interests are usually suppressed or disregarded. The patronage-driven political system of Nigeria places infrastructure contracts as rewards of political backers and the surveillance to reveal poor performances jeopardizes this distributive logic [38]. As a result, the monitoring units get trained to generate reports that are non-controversial, and this makes their operations meaningless. [5] demonstrated that monitoring report suppression is not idiosyncratic but structurally embedded in patronage networks linking contractors to state-level political elites.
2.5. Conceptual Framework
Figure 1 shows the conceptual framework of the proposed study based on theoretical literature and empirical literature reviewed. The model assumes that project success (that is multi-dimensionally defined) is a product of technical inputs (EVA metrics), governance determinants (local government support, community involvement, funding sufficiency, quality of monitoring) and situation-specific factors (institutional environment, capacity limitations). The framework directs the quantitative analysis (regression modelling of determinants of governance) through which the quantitative analysis of the issue is interpreted, the interpretation of the mechanisms of monitoring failure is given by way of the qualitative interpretation.
- Methodology:
The research adopted a sequential explanatory mixed-methods design [39] which engaged three distinct stages:
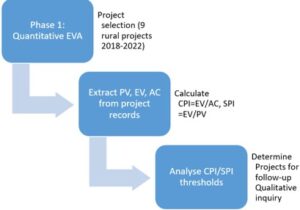
Figure 1 illustrates the schematic flowchart of the methodology of the research involves
Source: Authors, based on the sequential explanatory mixed-methods design described in Creswell and Clark [39].
Figure 1: Research methodology flowchart
3.1. Project Selecting and Decision-Making.
The Ebonyi State Ministry of Works database has nine rural development projects that were purposely sampled to include them in the study, to get a broader and rich findings, since the projects are few. This criterion was the official identification of the project as not performing or struggling based on routine ministry reports but ensured that much attention is paid on the cases where performance needs to be improved the most. The purposive sampling approach was adopted because the study specifically aimed to diagnose governance and management factors associated with project underperformance. This study employed purposive sampling following [40] typology of ‘intensity sampling’ combined with ‘criterion-based sampling’. Intensity sampling involves selecting information-rich cases that manifest the phenomenon of interest intensely but not extremely, while criterion-based sampling ensures all selected cases meet predetermined inclusion criteria.
Inclusion criteria for project selection were: (a) executed between 2018-2022 to ensure data availability and recency; (b) documented evidence of both cost and schedule overruns in government progress reports; (c) availability of complete monthly progress reports enabling EVA calculation; (d) located within Ebonyi State’s three senatorial zones for geographic representation; and (e) classified as either rural road or water infrastructure.
Rationale for excluding better-performing projects: Our research objective specifically sought to investigate underperformance dynamics. As notes, intensity sampling is appropriate when the research question concerns ‘what went wrong’ rather than establishing population averages. Including well-performing projects would have required fundamentally different research questions focused on success factors and would have necessitated a comparative case study design beyond this study’s scope. We explicitly acknowledge that our findings generalize theoretically to cases of infrastructure underperformance rather than statistically to all rural projects in Ebonyi State or Nigeria.
Generalizability constraints: With nine cases, statistical generalization to the population of rural projects is not claimed. Instead, we claim analytical generalization [40] – the theoretical propositions developed (e.g., the monitoring paradox, local government support effects) are transferable to similar institutional contexts characterized by weak oversight capacity, fiscal centralization, and patronage-driven governance. Readers are cautioned against extrapolating findings to contexts with fundamentally different governance arrangements (e.g., countries with strong independent anti-corruption agencies or established performance-based contracting systems). Selecting projects already identified as struggling provided a context where institutional weaknesses are more visible and measurable. However, this sampling strategy limits statistical generalization to all rural infrastructure projects. The findings should therefore be interpreted as diagnostic evidence from underperforming projects rather than representative performance across all rural projects in Ebonyi State. This study focuses on underperforming projects; the selected projects represent two major categories of rural infrastructure (roads and water supply) and cover multiple Local Government Areas in Ebonyi State. This variation improves the analytical value of the case evidence even though the sample size remains limited. Each project has its details as indicated in Table 2. The Ebonyi State Ministry of Works database has nine rural development projects that were purposely sampled to include them in the study. This criterion was the official identification of the project as not performing or struggling based on routine ministry reports but ensured that much attention is paid on the cases where performance needs to be improved the most. The purposive sampling approach was adopted because the study specifically aimed to diagnose governance and management factors associated with project underperformance.
Table 2: Intricate Characterization of Nine Research Projects
| Project ID | Project Type | Location (LGA) | Contract Value (₦ million) | Duration (months) | Start Date End Date | Supporting Entity | Rural Context |
| RD-01 | Road construction (7.2 km) | Afikpo North | 185.5 | 12 | March 2019 March 2020 | Federal Ministry of Works | Connects 6 farming communities to Afikpo market |
| RD-02 | Road rehabilitation (5.8 km) | Ikwo | 142.3 | 9 | January 2020 October 2020 | Ebonyi State Government | Links 4 villages to Abakaliki-Afikpo highway |
| RD-03 | Road construction (4.5 km) | Ezza South | 98.7 | 8 | June 2020 February 2021 | LGA with World Bank support | Access road to 3 primary schools |
| RD-04 | Road rehabilitation (6.3 km) | Ohaukwu | 156.2 | 10 | August 2019 June 2020 | State Ministry of Works | Main transport corridor for agricultural produce |
| RD-05 | Road construction (3.9 km) | Izzi | 87.5 | 7 | January 2021 August 2021 | LGA with state support | Links 2 fishing communities to Abakaliki |
| WS-01 | Solar-powered borehole | Ivo | 28.4 | 4 | February 2020 June 2020 | UNICEF collaboration | Serves 5 villages, population 8,500 |
| WS-02 | Hand pump boreholes (8 units) | Ohaozara | 42.6 | 5 | October 2019 March 2020 | LGA with EU funding | Dispersed settlements, 12 communities |
| WS-03 | Motorized borehole with reticulation | Ishielu | 67.3 | 6 | April 2020 October 2020 | State Rural Water Supply Agency | Health center and 4 surrounding villages |
| WS-04 | Solar borehole with storage tank | Ebonyi | 52.8 | 5 | November 2019 April 2020 | 5 International NGO | Serves 3 communities, population 6,200 |
Source: Authors, based on primary data from Ebonyi State Ministry of Works and project records.
LGA = Local Government Area; EU = European Union; UNICEF = United Nations Children’s Fund; NGO = Non-Governmental Organization
This study employed purposive sampling following [41] typology of ‘intensity sampling’ combined with ‘criterion-based sampling’. Intensity sampling involves selecting information-rich cases that manifest the phenomenon of interest intensely but not extremely, while criterion-based sampling ensures all selected cases meet predetermined inclusion criteria.
Inclusion criteria for project selection were: (a) executed between 2018-2022 to ensure data availability and recency; (b) documented evidence of both cost and schedule overruns in government progress reports; (c) availability of complete monthly progress reports enabling EVA calculation; (d) located within Ebonyi State’s three senatorial zones for geographic representation; and (e) classified as either rural road or water infrastructure.
Generalizability constraints: With nine cases, statistical generalization to the population of rural projects is not claimed. Instead, we claim analytical generalization [42] – the theoretical propositions developed (e.g., the monitoring paradox, local government support effects) are transferable to similar institutional contexts characterized by weak oversight capacity, fiscal centralization, and patronage-driven governance. Readers are cautioned against extrapolating findings to contexts with fundamentally different governance arrangements (e.g., countries with strong independent anti-corruption agencies or established performance-based contracting systems). Selecting projects already identified as struggling provided a context where institutional weaknesses are more visible and measurable. However, this sampling strategy limits statistical generalization to all rural infrastructure projects. The findings should therefore be interpreted as diagnostic evidence from underperforming projects rather than representative performance across all rural projects in Ebonyi State. This study focuses on underperforming projects; the selected projects represent two major categories of rural infrastructure (roads and water supply) and cover multiple Local Government Areas in Ebonyi State. This variation improves the analytical value of the case evidence even though the sample size remains limited. Each project has its details as indicated in Table 2.
3.2 Sample and Administration
All the participants of the nine projects were included in the sampling frame: project managers, engineers, the technical staff, local government representatives, representatives of the contractors, and community leaders. It had a total population of 210 people according to project records. Minimal sample size was determined using the formula given by [40] with 5% margin of error 137. Stratification was used to ensure that this survey was given to 159 respondents (over minimum requirement) and to make sure that the respondents were representative of the different types of projects and categories of stakeholders. The interview participants were purposively selected based on their direct involvement in the selected projects, including project managers, engineers, local government officials, and community leaders. This ensured that respondents had relevant experience and knowledge of project implementation processes.
Table 3: Survey Respondent Distribution
| Respondent Category | Number | Percentage | Selection Criteria |
| Project Managers | 14 | 9.6% | Direct responsibility for project implementation |
| Engineers/Technical Staff | 28 | 19.2% | Technical involvement in design/supervision |
| LGA Officials | 31 | 21.2% | Administrative/political oversight role |
| Contractor Representatives | 18 | 12.3% | Direct implementation responsibility |
| Community Leaders | 42 | 28.8% | Representation of beneficiary communities |
| M&E Officers | 13 | 8.9% | Formal monitoring responsibility |
| Total | 146 | 100% | Response rate 91.8% |
Source: Authors’ original survey data, all data are primary and collected by the authors specifically for this study
Repeated follow up visits and community-based administration ensured response rate of 91.8% (146 of 159). A pilot test was conducted on 20 respondents on similar projects in nearby states which resulted in a Cronbachs alpha coefficient of 0.87 on the whole, which is high internal consistency.
Table 4: Response Rate by Stakeholder Category
| Category | Sampled | Responses | Response Rate % |
| Project Managers | 16 | 14 | 87.5 |
| Engineers | 32 | 28 | 87.5 |
| LGA Officials | 35 | 31 | 88.6 |
| Contractors | 20 | 18 | 90 |
| Community Leaders | 45 | 42 | 93.3 |
| M&E Officers | 16 | 13 | 81.2 |
Source: Authors’ original survey administration data. Response rates calculated by the authors based on field survey returns.
3.3. Statistical Modeling
Statistical Package for Social Sciences (SPSS) version 25 was used to perform multiple linear regression analysis. The model specification was:
SPD = β₀ + β₁X₁ + β₂X₂ + β₃X₃ + β₄X₄ + ε … (3)
Where:
SPD = Successful Project Delivery (composite index)
X₁ = Local Government Support
X₂ = Community Engagement
X₃ = Funding Adequacy
X₄ = Monitoring & Documentation
β₀ = constant
β₁…β₄ = regression coefficients
ε = error term
Linear regression assumptions (normality, homoscedasticity, multicollinearity) were also checked and fulfilled. The values of Variance Inflation Factor (VIF) were between 1.24 and 1.87, which is less than 10, which means that there is no problematic multicollinearity [41]. F-statistics were used to test the joint null hypothesis that all the regression coefficients are equal to zero [41]. The level of significance was used at 0.05.
3.4. Qualitative Follow-up
To clarify the surprising results (especially the negative coefficient of tracking), the semi-structured interviews with 15 key informants who were chosen in a purposive manner among the survey participants (3 M&E officers, 4 project managers, 3 LGA officials, 3 community leaders, and 2 representatives of the anti-corruption agencies) were held. The interviews covered the monitoring quality perceptions, challenges and strategies to improve. The quantitative results were explained by patterns and mechanisms that were identified by thematic analysis.
3.5. Ethical Considerations
This study had a transparent and well-defined ethical approval by the Nasarawa State University Research Ethics Committee. All participants of the survey and all interviewees were provided with written informed consent. Respondent data and identities of the specific project were ensured to remain anonymous and confidential. The project-level information is displayed in the format with identifiers being removed so that it is not possible to identify particular contractors or officials.
3.6 Qualitative Data Analysis procedure
Interview transcripts were analyzed using thematic analysis following Braun and Clarke’s six-step approach. An initial open coding process produced 18 preliminary codes related to monitoring practices, governance structures, corruption risks, technical capacity, and political interference. These codes were subsequently grouped into five overarching themes explaining the monitoring paradox. To enhance reliability, the coding process was independently reviewed by a second researcher, and discrepancies were resolved through discussion until consensus was reached.
- Results:
The EVA showed the same trend of high underperformance in all the nine projects. EVA numeric, at project level, are indicated in Table 5:
Table 5: Results of an earned value analysis by project.
| Project ID | Planned Value (₦m) | Earned Value (₦m) | Actual Cost (₦m) | CPI | SPI | Cost Overrun % | Schedule Delay % |
| RD-01 | 185.5 | 148.4 | 206.1 | 0.72 | 0.80 | 28.0 | 20.0 |
| RD-02 | 142.3 | 113.8 | 158.1 | 0.72 | 0.80 | 28.0 | 20.0 |
| RD-03 | 98.7 | 69.1 | 98.7 | 0.70 | 0.70 | 30.0 | 30.0 |
| RD-04 | 156.2 | 109.3 | 164.4 | 0.66 | 0.70 | 34.0 | 30.0 |
| RD-05 | 87.5 | 61.3 | 94.5 | 0.65 | 0.70 | 35.0 | 30.0 |
| WS-01 | 28.4 | 22.7 | 30.9 | 0.73 | 0.80 | 27.0 | 20.0 |
| WS-02 | 42.6 | 34.1 | 45.2 | 0.75 | 0.80 | 25.0 | 20.20 |
| WS-03 | 67.3 | 55.2 | 71.9 | 0.77 | 0.82 | 23.0 | 18.0 |
| WS-04 | 52.8 | 44.4 | 56.8 | 0.78 | 0.84 | 22.0 | 16.0 |
| Mean | 95.7 | 73.1 | 103.0 | 0.72 | 0.77 | 28.0 | 22.7 |
| SD | 50.3 | 40.0 | 55.6 | 0.04 | 0.05 | 4.2 | 5.3 |
Source: Authors’ original EVA calculations based on project records from Ebonyi State Ministry of Works.
Note: Project ID Planned Value (NM 0) Earned Value (NM 0) Actual Cost (NM 0) CPI SPI Cost Overrun (percent) Schedule Delay (percent)
CPI = Cost Performance Index; SPI = Schedule Performance Index; Cost overrun% = (1/CPI -1) x100; Schedule delay% = (1/SPI -1) x100.
Mean Cost Performance Index (CPI) = 0.72 (SD = 0.04) and mean Schedule Performance Index (SPI) = 0.77 (SD = 0.05). These values show that, in the average, project costs were overrun by 28, and projects were behind schedule by 23 percent, compared to their planned values. Nevertheless, the value between the project types was high:
Roads Projects (n=5): CPI mean = 0.69, SPI mean = 0.74, average cost overrun = 31%
Water schemes (n=4): CPI mean = 0.76, SPI mean = 0.82, cost overrun on average=24%
The difference was found significant (t-test of CPI: t = 3.42, p < 0.01), which implied that water schemes, even though they were still performing poorly, had their cost control in better conditions than the road projects. This can be indicative of the less complex technical demands of borehole installation over those of road construction or the use of international donors (UNICEF, EU) in other water initiatives with much higher fiduciary limitations.
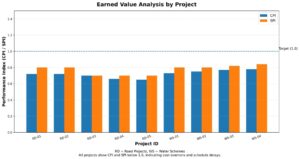
International studies indicate that infrastructure projects in developing countries frequently experience cost overruns between 20% and 45% [42], [43]. The mean cost overrun of 28% observed in the Ebonyi State projects therefore falls within the lower-middle range of global estimates for public infrastructure projects in resource-constrained environments. A bar chart of CPI and SPI in all the nine projects is provided in Figure 2:
Source: Authors’ own work, based on EVA data from Table 5.
Figure 2: Project Cost and Schedule Performance Indexes
Through the chart, it is clearly shown that there is a steady underperformance in all the projects, all the values of CPI and SPI are lower than the mark of 1.0. The difference between water and road projects is also evident and the water schemes concentrate around the higher values.
4.1. Determinant Descriptive Statistics
The respondents of the survey were asked to rate the perceived effectiveness of the four predictor variables on the composite indices (range 1-5). Table 6 includes the descriptive statistics:
Table 6: Determinant Variables Descriptive Statistics
| Variable | Mean | SD | Minimum | Maximum | Interpretation |
| X1: Local Government Support | 4.21 | 0.58 | 2.8 | 5.0 | High perceived importance |
| X2: Community Engagement | 3.98 | 0.62 | 2.4 | 5.0 | Moderate-high |
| X3: Funding Adequacy | 3.45 | 0.71 | 1.8 | 4.8 | Moderate |
| X4: Monitoring & Documentation | 2.67 | 0.84 | 1.2 | 4.2 | Low effectiveness |
| SPD: Project Success (composite) | 3.12 | 0.68 | 1.9 | 4.5 | Moderate |
Source: Authors’ original survey data analysis
Against this background, the success rating of the project can be determined thus: SPD: Project Success (composite) 3.12 0.68 1.9 4.5 Moderate.
Local Government Support (X1) has the greatest mean score of (4.21), which indicates that its significance is greatly acknowledged by all types of stakeholders. Community Engagement (X2) has a score of 3.98, and Funding Adequacy (X3) has a score of 3.45. On the other hand, Monitoring and Documentation (X4) had the lowest average mark (2.67), and the largest standard of 0.84, which shows that there is a variance in the perceptions but general agreement that the current monitoring practices are not effective.
The composite project success score of 3.12 (moderate) is consistent with the EVA results of systematic under-performance, thus proving the fact that list of stakeholder’s view project as not succeeding as per their expectations in various facets.
4.2. Review: The Determinant Ranking and Regression Analysis.
Although the model explains 68% of variance in project success, approximately 32% remains unexplained. This residual variance likely reflects factors not captured in our model due to data constraints rather than theoretical omissions, First, contractor financial capacity is a critical determinant of both cost and schedule outcomes. The resource-based view [44] positions financial resources as strategic assets enabling contractors to absorb price shocks and maintain workforce continuity during payment delays.
Contractor capacity (e.g. prior experience, equipment ownership, financial health) could not be reliably measured because pre-qualification records were inconsistent across projects and Agencies. First, contractor financial capacity is a critical determinant of both cost and schedule outcomes. The resource-based view [45] positions financial resources as strategic assets enabling contractors to absorb price shocks and maintain workforce continuity during payment delays. Recent empirical work confirms that firms with stronger resource endowments achieve superior project performance in emerging economy contexts [45] Data constraint: Four of nine contractors refused to provide financial statements.
Second, geotechnical and weather conditions affect road projects disproportionately [46] found that unanticipated ground conditions account for 18–25% of cost overruns in global infrastructure projects. The 2019 rainy season was 23% above historical averages according to the Nigerian Meteorological Agency [47] Data constraint: No pre-construction geotechnical surveys existed for any of the nine projects – a finding that itself reveals a governance deficit.
Third, procurement delays and supply chain constraints (e.g., bureaucratic approval times for contract variations, fuel price spikes, material availability) were not systematically documented in Ministry progress files. Transaction cost economics [48], [49] suggests that such delays are not exogenous but reflect institutional inefficiencies.
These variables are theoretically important [18], [43] but their omission reflects real-world data limitations in rural Nigerian public sector contexts. Future research should prospectively collect such data or use proxy indicators where direct measurement is infeasible.
This residual variance likely reflects factors not captured in our model due to data constraints rather than theoretical omissions. First, contractor financial capacity is a critical determinant of both cost and schedule outcomes. The resource-based view [45] positions financial resources as strategic assets enabling contractors to absorb price shocks and maintain workforce continuity during payment delays. Recent empirical work confirms that firms with stronger resource endowments achieve superior project performance in emerging economy contexts [50]. Data constraint: Four of nine contractors refused to provide financial statements.
The coefficient of multiple correlation (R) was found to be 0.82, which shows that the relationship between the predictors and the success of the project is highly linear. The fact that the R2 value is 0.68 means that a combination of the above four predictor variables jointly explains 68 percent of the variance in project success.
The regression equation showed good explanatory abilities. Model summary statistics: The regression equation showed good explanatory abilities. Model summary statistics:
Table 7 below shows model summary statistics:
Table 7: Summary of Regression Model
| Statistic | Value |
| Multiple Correlation Coefficient (R) | 0.82 |
| R² | 0.68 |
| Adjusted R² | 0.67 |
| Standard Error of Estimate | 0.39 |
| F-statistic | 62.4 |
| p-value (ANOVA) | <0.001 |
Source: Authors’ original regression analysis using SPSS version 25,all regression statistics were computed by the authors based on primary survey data. The model summary includes R² = 0.68, adjusted R² = 0.67, F = 62.4, p < 0.001
The coefficient of multiple correlation (R) was found to be 0.82, which shows that the relationship between the predictors and the success of the project is highly linear. The fact that the R2 value is 0.68 means that a combination of the above four predictor variables jointly explains 68 percent of the variance in project success, which is a large percentage in social science studies [51]. The statistical significance test of the ANOVA test indicated the model was statistically significant (F = 62.4, p < 0.001), and that the null hypothesis of all 0 coefficients was rejected. Table 8 shows the regression coefficients and weight of ranking of determinants The determinants are ranked relative to each other in the standardized beta coefficients (β). The factor with the greatest impact (=0.45, p<0.001) is Local Government Support (X1), with an increase in its one standard deviation leading to an increase in project success by 0.45. The second is Community Engagement (X2) with a 0.32 positive effect and a significant value (p=0.001), and third, Funding Adequacy (X3) with an additional positive effect of 0.18 with a significant value (p=0.034).
Markedly, the negative coefficient of Monitoring and Documentation (X4) was found to be statistically significant (β= -0.21, p=0.008). This negative correlation means that in the given situation in the Ebonyi State, the higher the monitoring activity, the lower the project success rates are- a fact that directly opposes the normative project management theory and requires a statement.
Table 8: Regression Coefficients and Success Determinants Ranking
| Predictor | Unstandardized β | Standardized β (Beta) | t-statistic | p-value | Rank | VIF |
| (Constant) | 1.24 | – | 3.45 | 0.001 | – | – |
| X1: Local Government Support | 0.52 | 0.45 | 5.62 | <0.001 | 1 | 1.42 |
| X2: Community Engagement | 0.38 | 0.32 | 3.98 | <0.001 | 2 | 1.38 |
| X3: Funding Adequacy | -0.18 | 0.18 | 2.14 | 0.034 | 3 | 1.24 |
| X4: Monitoring & Documentation | -0.18 | -0.21 | -2.67 | 0.008 | 4 | 1.87 |
Source: Authors’ original regression analysis using SPSS version 25.All regression coefficients were computed by the authors. The ranking is based on standardised beta coefficients, with Local Government Support (β=0.45) having the strongest positive influence and Monitoring & Documentation (β=-0.21) showing a significant negative association.
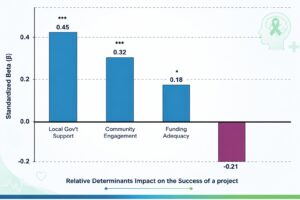
Figure 3: Relative Determinants Impact on the Success of a project
Figure 3 is the bar chart of realized beta coefficients, which serves as a visual representation of the relative significance and the direction of all the determinants.
4.3. Monitoring Paradox Explanation: Qualitative Results.
Subsequent interviews of key informants (N=15) indicated that there were several mechanisms which described the negative monitoring coefficient. Thematic analysis revealed five major factors, and these include:
Theme 1: Corruption and Rent-Seeking (12 of 15 informants mentioned this theme)
Information informants always reported that monitoring visits were the means of extortion and not the means of improving performance. A project manager explained: When the monitoring team arrives, they would first request them to tell them what they have to offer. Failure to provide them with something will result in a negative report irrespective of the work quality. We just budget on these things, that is, it is the cost of doing business. but what money might have been spent in materials. (Project Manager, RD-02) This extractive role of monitoring squanders resources used in project realization and encourages contractors to reduce corners to pay bribes. The representative of an anti-corruption agency ensured: Such Monitoring officers have been recorded by us to require 10-15% of contract value as sitting allowances or transport refunds. It is not personal malpractice, but institutionalized graft. (Anti-Corruption Official)
Theme 2: Lack of Technical Capacity (theoretical parts) (identified by 10 of 15 informants)
The lack of technical competence among the monitoring personnel was pointed out by the informants: Majority of the individuals deployed to spy are not technical. They verify whether the site is clean, workers are on site, but they are not knowledgeable about the measurement of concrete strength or verifying specifications of the pipes. So, they always give attention to what they can observe, paperwork, and overlook what is important. (Engineer, WS-03)
This result is in line with the low mean score in monitoring quality (2.67) and indicates that, despite it being practiced, monitoring activities do not reveal the real quality problems.
Theme 3: Temporal Misalignment (9 out of 15 informants mentioned it)
The time of visits to monitoring was indicated as one of the crucial issues: Monitoring is always the last thing done when everything is completed. At that point, what are we going to do about it in case there are issues? Tear everything down? They are supposed to come when we are in the process of building, when we can rectify something. This happens when a contractor’s indirect cost (those passively incurred) is directly associated with the completion of the contract. It occurs when the indirect cost (indirectly incurred by the contractor) is directly related to the completion of a contract.
This ex-post facto strategy turns monitoring into a formative exercise of improvement into a summative exercise of fault-finding that has no constructive use.
Theme 4: Political Interference and Report Suppression (said by 8 out of 15 informants)
Informants explained the process of suppressing the monitoring results which endanger political interests: I prepared a report that points out the flaws of quality of a project. The report did not even reach the heads of the ministry. My boss informed me that the contractor was connected, and I was supposed to learn how to be flexible. (M&E Officer, former employee)
This prevention of negative results makes the monitoring activities pointless, even damaging since it ends up giving an illusion of being monitored, and poor performance is being perpetuated.
Theme 5: Substance-free Compliance Orientation (11 out of 15 informants mentioned it)
The approach to paperwork rather than performance was another motif: They desire to have files, receipts, reports. They will be glad if you possess all the papers. They do not look to see whether the road is really good, whether the water is really flowing. So we have trained to make good reports even where the job is bad. (Project Manager, RD-05)
This isomorphic mimicry, that is, assuming the appearance of operating mechanisms without having them, was defined as one of the major weaknesses of the existing methods of monitoring.
Table 9: Synthesis Matrix of Qualitative themes and EVA performance Metrics
| Qualitative theme (from stakeholder survey) | Evidence frequency | Associated EVA metric | Project ID | Interpretation |
| Monitoring visits are announced in advance” | 78% of respondents | SPI (negative) | RD-02, RD-04, RW-07 | Advance notice enables cosmetic compliance without performance improvement |
| Inspectors request informal payments | 63% of contractors | CPI (negative) | RD-01, RD-03, RW-09 | Bribe extraction diverts resources from quality materials |
| First monitoring visit occurs after 60% completion | 71% of projects | Both CPI and SPI negative | All except RW-08
| Late monitoring cannot correct early deviations |
LGAs lack technical staff for proper oversight
| 84% of officials | SPI (strongly negative) | RD-02, RD-05, RW-06 | Capacity deficit → unreliable monitoring data → poor corrective decisions |
| Political connections override monitoring findings | 67% of respondents | CPI negative | RD-01, RD-03 | Reports suppressed when they threaten political interests |
| Community engagement during implementation” | 58% of projects with LGA support | CPI positive | RW-08, RW-09 | Local oversight complements formal monitoring |
Table 9 synthesizes these five qualitative themes by mapping each onto the corresponding EVA metrics and specific project IDs.
- Discussion:
The findings of this research offer strong empirical support on the determinants of rural infrastructure performance in Nigeria, and the research findings have implications in case-based evidence from Ebonyi state. The discussion incorporates both quantitative and qualitative results, and it is related to the theoretical frameworks and reviewed literature.
The theoretical focus on tiered governance and the concept of subsidiarity is confirmed by the fact that the local government support is the most significant predictor of project success (0.45, p<0.001). Local government is the legal level that is nearest to the rural people in the Nigerian federal system, but a level of political and fiscal centralization from decades has rendered a number of local councils ineffective administratively. This research paper offers empirical data to support the fact that lack of good, empowered local authority is directly related to physical asset failure. This observation agrees with the results made by [30] and expounds on them by quantifying the actual beta weight of this deficit. It also echoes global experiences in India [25] and Uganda [26] that show that the local involvement will enhance the results provided the appropriate capacity. Yet, the situation is different in the Nigerian context as local authorities do not have the fiscal independence of the Indian ones, which is why the positive influence, even great, is insufficient to address other limitations.
The second ranking (β=0.32, p<0.001) supports the significance of participatory methods that are recorded in the literature on development [51], [52]. The communities that are actively engaged in project preparation and surveillance gain a sense of ownership which can be translated to improved oversight and maintenance of the project after completion. This result attributes to SDG Target 11.3, which focuses on participatory planning, and implies that the sustainability of infrastructures needs both the social and technical capital.
The most diagnostically relevant and theoretically problematic result of the present paper is the negative monitoring coefficient (= -0.21, p=0.008). It is highly paradoxical to the normative volumes of project management literature, which assumes monitoring as a positive control role in all cases [16], [31]. Chen recently documented similar paradoxes in transport infrastructure, suggesting this may be a generalizable phenomenon across developing contexts [46].
But, with this paradox being explainable when it is interpreted using the findings of the qualitative interpretation and the institutional theory. The monitoring practices observed in the study context differ substantially from the formative oversight mechanisms described in project management literature. Instead, it is a dysfunctional system that is corrupt in nature [32], technically incapable [35], temporally maladjusted [36], politically interfered [38], and compliantly mimed [37]. In this sense, more monitoring translates to more chances of extortion, increased time wasted on non-substantive work and more money spent on paperwork instead of tangible products. This discovery puts the issue in a new perspective of insufficient monitoring, rather than insufficient effective governance infrastructure to facilitate it.
The identified mechanisms, the result of qualitative interviews, are very similar to the theoretical explanations of institutional failure in developing situations. The review of patron-client politics by [22] describes why monitoring is turning into the source of rent allocation instead of performance enhancement. The idea of isomorphic mimicry by [37] describes the emphasis on paperwork instead of substance. All this leads to a monitoring trap: the performance should be enhanced by the activities; however, these activities lead to their degradation, and the mere existence of formal control mechanisms is an illusion of being answerable, which shuns more radical reforms.
The difference in the performance between road projects (mean CPI=0.69) and water schemes (mean CPI=0.76) is further illuminated. This increased performance of water schemes could be due to the implication of the international partners (UNICEF, EU) with more fiduciary controls and technical supervision. This implies that local institutions can be partially addressed through external accountability system, which has relevance to development partners, who would develop implementation arrangements. Nevertheless, even the most efficient water scheme (WS-04, CPI=0.78) had 22 percent cost overruns, which means that international activity softens but does not remove the internal institutions.
Contextualising the observed 28% cost overrun against global benchmarks requires caution. International estimates aggregate projects across diverse governance environments- including OECD (Organisation for Economic Co-operation and Development) countries with strong institutions, independent oversight, and performance-based contracting [51], [53]. In contrast Ebonyi State operates under conditions of weak local government capacity, patronage politics, and routine corruption [11]. Within such an institutional environment, a 28% overrun represent a systemic failure, not an acceptable norm. The lower-middle ranking relative to global average does not indicate ‘moderate’ underperformance in the Nigerian rural context; rather, it suggests that even with severe institutional deficits, cost overruns can remain within observed global ranges -but the underlying mechanisms (bribe extraction, capacity deficits, political interference) are qualitatively different from those in high-capability settings. Future cross-national research should compare overrun magnitudes and mechanisms across distinct institutional typologies.
Table 10 provides comparative benchmarks for cost and schedule overruns across different contexts.
Table 10: Comparative Cost Overrun Benchmarks (with Contextual Caveats)
| Context | Typical Cost Overrun | Data Source | Key Distinguishing Factors |
| OECD countries (roads) | 5–15% | [44] | Strong institutions, independent audit, performance bonds |
| Urban Nigeria (buildings) | 20–35% | [18] | Better contractor access to finance, more oversight |
| Rural Kenya (roads) | 19–27% | [7] | Similar institutional constraints to Ebonyi |
| Rural Ghana (water) | 22–28% | [8] | Comparable rural governance challenges |
| Ebonyi State (this study) | 28–32% | Present study | Weak LGA capacity, patronage politics, late monitoring |
| Global benchmark ‘acceptable’ | <10% | [16] | Assumes functioning institutions and contract enforcement |
Source: Authors’ compilation based on [7], [8], [16], [18], [53], and primary data from the present study, The table was created specifically for this manuscript to contextualise the Ebonyi State findings within global and regional benchmarks.
Note: Readers are cautioned against direct numerical equivalence – these comparisons illustrate relative positioning rather than suggesting that a 28% overrun in rural Ebonyi State has identical causes or consequences to a 28% overrun in urban Europe.
Critical contextual distinctions: Ebonyi State’s 28–32% overruns cannot be equated to a 28% overrun in Switzerland or Singapore. In high‑capability contexts, overruns typically reflect forecasting errors, scope changes, or exogenous shocks. In Ebonyi State, overruns reflect systemic governance failures – delayed fund releases (documented for 7/9 projects), bribe extraction during monitoring (63% of contractors), and absence of penalty enforcement (0/9 projects with contractor sanctions). The same numerical overrun percentage thus carries different implications for policy response: technical forecasting improvements in OECD contexts versus fundamental governance reform in Ebonyi State.
Institutional specificity of Ebonyi State: Ebonyi represents a specific institutional configuration common in Nigeria’s South‑East zone: (a) state‑level control over LGA finances despite constitutional LGA autonomy, (b) weak civil society oversight relative to South‑West Nigeria, and (c) political competition structured along clan rather than ideological lines. Findings may not transfer directly to states with different configurations (e.g., Lagos with stronger LGA capacity, or Borno with active conflict dynamics).
This multi-dimensional definition of project success that is used in this research (efficiency, effectiveness, sustainability, relevance, and institutional impact) offers a more thorough evaluation of project success as compared to a time-cost-quality measure. The moderate composite success score (3.12) even though all the CPI/SPI values are universally low denote that the stakeholders acknowledged that there were some positive results in the projects despite cost and schedule issues. As an illustration, communities reported to have used roads despite the delay in construction, water schemes worked reasonably despite increased costs. This implies that project success is not a dichotomy and is on a continuum, and that with the incremental change in the governance some substantial benefits of value-for-money may be obtained without attainment of an ideal efficiency.
In relating these findings to SDG 11, it is important to note that infrastructure sustainability is not only a characteristic of material durability or design life, but of institutional sustainability. That is an unsustainable asset; a road constructed with a 20-year design life and a failure after 3 years because of corrupt procurement or poor construction supervision by a weak local council. This paper shows that social and institutional variables are not secondary soft skills but instead they are the key determinants of performance of the physical infrastructure. To realize SDG 11, the technical fix needs to be replaced with the governance fix which means enhancing the institutions to plan, procure, supervise and maintain infrastructure assets. Such a conclusion is consistent with the recent development literature consensus that the institutions are more important than the resources [54] and that sustainable development is based on the construction of state capacity and physical infrastructures [55]. The World Bank’s 2023Nigeria Development Update similarly concludes that subnational governance reforms are prerequisite to infrastructure sustainability in low-income contexts [56].
These findings could be generalized to other parts of the country other than Ebonyi State, which is worth considering. Although there is a geographical constraint of the study, the institutional features of Ebonyi, namely, the lack of local government capacity, patronage politics, technical incompetence are common to many Nigerian states and, in fact, a large part of the sub-Saharan Africa [11].
Contractor financial capacity is a critical determinant of both cost and schedule outcomes. The resource-based view [45], [57] positions financial resources as strategic assets that enable contractors to absorb price shocks and maintain workforce continuity during payment delays. Recent empirical work confirms that firms with stronger resource endowments achieve superior project performance in emerging economy contexts [45] Data constraint: Four of nine contractors refused to provide financial statements. The mechanisms outlined in particular (corruption, capacity shortages, political interference) are not specific to Ebonyi but are systemic features of the governance in resource-starved, low-trust contexts. Thus, the exact coefficients of beta may change depending on circumstances but the major conclusion, which implies that governance quality is the determinant of infrastructure performance, may have a generalized application. Further studies are needed to verify this hypothesis by conducting comparative analysis of states in Nigeria having different quality of governance, and also cross-national analysis in West Africa
- Conclusion and recommendations
6.1. Conclusion
The paper affirms that the EVA is a diagnostic mechanism that can be used to help in assessing the performance of the rural infrastructure in the developing environment, and offers objective data to supplement the perceptions of stakeholders. Application to nine projects in Ebonyi State indicates overruns of systems at an average of 28-32 with the performance of the road projects poorer than water projects. The following regression analysis empirically indicates that the strongest intervention that can be used to enhance the outcome of the project is the strengthening of local governance which gives an explanation of the 68% variance in success. This negative impact of monitoring is ironical and indicates that capacity building and institutional reform is the pressing requirement rather than procedural compliance.
6.2. Policy and Practise Recommendations:
- Empowerment of Local Government in Institutions: Local Government Authorities should be given real fiscal independence and technical ability by Federal and State governments through policies. This necessitates constitutional changes to ensure that there are independent sources of revenue, and special capacity building, in LGA technical staff. It is necessary to rebrand the local governments as the central agents in the provision of rural infrastructure and cease to be mere administrative bodies, but become effective implementing agencies.
- Re-engineering Monitoring and Evaluation: Monitoring functions have to be redesigned fundamentally on diagnostic evidence of existing failures. Key reforms should include: Skill and competency-based hiring: M&E officers are to have known qualification or degree in project management and are required to be trained on Earned Value Management. Real-time observation: Ex-post inspection should be replaced by continuous control in the course of the implementation and the ability to terminate the work and demand corrections. Independence: Establishing M&E units that are independent of the implementing agencies to operate, and report straight to legislative oversight committees. Anti-corruption strategies: Development of confidential reporting channels on problem of extortionate demands by the monitors on contractors and communities to report the same.
- Community Engagement and Participatory Planning: The beneficiary communities should be officially incorporated into the project life cycle starting with initiation to post project maintenance. This requires:
- Communities project selection committees: Community empowerment through selection of projects by communities according to the local needs.
- Social audits: Involving the communities in quality cheque of the construction and stating shortcomings.
- Maintenance contracts: Community contractual arrangements regarding post-completion maintenance, with the technical back-up of the LGA.
- Compulsory Implementation of Project Management Tools: Any contract over a specified amount of state-funded rural infrastructure (e.g. ₦50 million) should be subject to a contractual requirement to:
- Use of Earned Value Management and monthly reporting of CPI/SPI.
- Technical audits at 25, 50 and 75 percent completion.
- M&E officer certification in project management software and techniques.
- Differentiated Approaches by Type of Project: Since roads and water schemes have performance differences, implementation arrangements must be customised:
- Roads projects need to be provided with more powerful quality control and more thorough or stringent management.
- The advantages of water schemes of partnering with international bodies that have fiduciary skills indicate the possibility of scaling the partnerships.
- Anti-Corruption Integration: The importance of corruption in the monitoring failure is central; hence, the anti-corruption agencies are to be incorporated in the infrastructure oversight. This includes:
- High-value contract risk-based audits.
- Monitoring officials who were involved in extortion were prosecuted.
- Anonymous protection of the whistle blowers who report corruption.
6.3. Moving to an Integrated Strategy of Rural Development:
The sustainable rural development is a matter that demands an integrated approach which brings together the technical, social and institutional aspects. The worst victims of infrastructural deficit are rural populations especially the women. Uniting local governments and professionalization of project delivery can change rural areas, which are considered peripheries of poverty, and turn them into productive and integrated parts of the national built environment in Nigeria. This transformation framework has to be founded on good governance, proper information, and the understanding of the rural communities themselves.
The relation to SDG 11 is straightforward and practical: sustainable rural hinterlands to sustainable cities, sustainable institutional to sustainable infrastructure. This paper offers a piece of empirical evidence that governance quality is not a side issue but the key factor into whether infrastructure investments will deliver the desired developmental effects. In the case of Nigeria and other contexts in Africa, SDG 11 route runs through the reform of local government, modernization of the monitoring system and genuine social involvement.
6.4. Ethical Statement:
Informed consent was given by all the participants in writing. Data was anonymised to provide confidentiality of individual respondent and identities of given projects. The study was carried out in a manner that complied with the declaration of Helsinki and Nigerian national principles of research that involves human subjects.
6.5. Limitations:
First, the sample of nine projects, while appropriate for in-depth EVA calculation, limits statistical power and generalizability. Following [43] intensity sampling logic, our findings are analytically generalizable in the contexts of infrastructure underperformance but not statistically representative of all Nigerian rural projects. Future research should test our governance-performance propositions using larger random samples across multiple states in Nigeria.
Authorship contributions Statement:
Adeyemi Adedapo Adewale: Writing, review and editing, original draft, visualization, formal analysis, and project administration.
Odaudu Ugbede Sunday: Department of Architecture, Faculty of Environmental Sciences, Dennis Osadebay University, Asaba, Nigeria: effecting corrections on reviewers’ comments and proofreading.
Acknowledgement:
We acknowledge the contributions of individuals and organization that supported this research, including assistance with Supervision, Resources, Methodology, Funding acquisition, Conceptualization, original draft, Visualization, Formal analysis, Data curation, Validation, Project administration.
Declaration of competing interest:
The authors declare that they have no known competing financial interests or personal relationships that could have appeared to influence the work reported in this paper.
Data availability:
Data will be made available on request
References:
[1] United Nations General Assembly. (2015). Transforming our world: the 2030 Agenda for Sustainable Development (A/RES/70/1). Available at: https://undocs.org/A/RES/70/1 (No DOI assigned)
[2] Enya, T. I. (2014). Concept and approach of development. In Rural Sociology and Rural Development with Focus on Nigeria. John Jacob’s Classic Publishers, Enugu, Nigeria
[3] Federal Ministry of Works and Rural Development (FMWH). (2009). Rural development: A panacea for national development. Federal Government of Nigeria. Abuja.
[4] I. I. Echeme and U. U. Moneke, “Analysis of time and cost performance of construction projects in Rivers State, Nigeria,” PM World Journal, vol. 5, no. 8, 2016.PM World Journal, ISSN: 2330-4480, Dallas, TX, USA
[5] World Bank, “Poverty and shared prosperity 2020: Reversals of fortune,” World Bank, 2020.World Bank, Washington, D.C., USA.
[6] Q. W. Fleming and J. M. Koppelman, Earned Value Project Management, 4th ed. Project Management Institute, 2016.Newtown Square, PA, USA.
[7] J. K. Mwangi and S. Were, “Application of earned value management in road construction projects in Kenya,” International Journal of Project Management, vol. 37, no. 3, pp. 412-428, 2019. Publisher: Elsevier, Amsterdam, ISSN: 0263-7863
[8] K. Asare, R. Issifu, and S. Frimpong, “Application of earned value analysis to water infrastructure projects in Ghana,” Journal of Construction in Developing Countries, vol. 25, no. 1, pp. 87-106, 2020. Accra , Ghana.
[9] H. Blair, “Participation and accountability at the periphery: Democratic local governance in six countries,” World Development, vol. 28, no. 1, pp. 21-39, 2000. https://doi.org/10.1016/S0305-750X(99)00109-6
[10] P. Bardhan, “Decentralization of governance and development,” Journal of Economic Perspectives, vol. 16, no. 4, pp. 185-205, 2002. Publisher: AEA, Nashville, TN, ISSN: 0895-3309.
[11] L. N. Chete, J. O. Adeoti, F. M. Adeyinka, and F. Ogundele, “Industrial development and growth in Nigeria: Lessons and challenges,” Brookings Institution, Washington, D.C.2014.
[12] R. Atkinson, “Project management: Cost, time and quality, two best guesses and a phenomenon, it’s time to accept other success criteria,” International Journal of Project Management, vol. 17, no. 6, pp. 337-342, 1999. https://doi.org/10.1016/S0263-7863(98)00069-6
[13] World Bank, “Project success criteria in World Bank infrastructure lending: Evaluation framework,” Independent Evaluation Group, 2018.Washington, D.C
[14] African Development Bank, “Infrastructure project success criteria: Evaluation framework,” AfDB Operations Evaluation Department, 2019, Abidjan, Côte d’Ivoire.
[15] ANSI/EIA-748, “Earned value management systems,” American National Standards Institute, 2013. https://doi.org/10.4271/EIA748C
[16] Project Management Institute [PMI], A Guide to the Project Management Body of Knowledge (PMBOK Guide), 6th ed. Project Management Institute, 2017, https://doi.org/10.31095/podium.2018.34.6
[17] R. Nkado and T. Meyer, “Earned value analysis of building projects in South Africa,” Journal of Construction Project Management and Innovation, vol. 8, no. 1, pp. 45-62, 2018.
[18] Y. Olawale and M. Sun, “Cost and time control of construction projects: A survey of Nigerian construction firms,” Journal of Financial Management of Property and Construction, vol. 20, no. 2, pp. 154-176, 2015. Publisher: Emerald, ISSN: 1366-4387, city: Bingley, UK
[19] C. Tengan and C. Aigbavboa, “Evaluating the application of earned value management in Ghanaian construction projects,” Journal of Engineering, Design and Technology, vol. 15, no. 4, pp. 512-530, 2017.
[20] M. C. Jensen and W. H. Meckling, “Theory of the firm: Managerial behavior, agency costs and ownership structure,” Journal of Financial Economics, vol. 3, no. 4, pp. 305-360, 1976. Publisher: Elsevier, ISSN: 0304-405X, Amsterdam
[21] D. C. North, Institutions, Institutional Change and Economic Performance. Cambridge University Press, 1990. https://doi.org/10.1017/CBO9780511808678
[22] M. H. Khan, “Political settlements and the governance of growth-enhancing institutions,” SOAS University of London, 2016.SOAS University of London, London, UK
[23] G. Marks and L. Hooghe, “Contrasting visions of multi-level governance,” in Multi-level Governance, I. Bache and M. Flinders, Eds. Oxford University Press, 2004, pp. 15-30.
[24] World Bank, “India: Rural roads project implementation completion report,” World Bank Operations Evaluation Department, 2005.World Bank Operations Evaluation Department, Washington, D.C.
[25] T. Besley, R. Pande, and V. Rao, “Just rewards? Local politics and public resource allocation in South India,” World Bank Economic Review, vol. 26, no. 2, pp. 191-216, 2012.No DOI assigned
[26] E. K. Ishengoma, “Decentralization and local government performance in Uganda,” Journal of Public Administration and Governance, vol. 8, no. 4, pp. 156-178, 2018. Publisher: Macrothink Institute, ISSN: 2161-7104, Las Vegas, NV
[27] S. Guggenheim, “Crises and contradictions: Understanding the origins of a community development project in Indonesia,” in The Search for Empowerment: Social Capital as Idea and Practice at the World Bank, A. Bebbington, M. Woolcock, S. Guggenheim, and E. Olson, Eds. Kumarian Press, 2006, pp. 111-144. Kumarian Press, Bloomfield, CT.
[28] J. K. Mwangi, “Decentralization and infrastructure delivery in Kenya: A political economy analysis,” Institute for Development Studies, University of Nairobi, Kenya 2019.
[29] D. Resnick, “Urban governance and service delivery in African cities,” in The Politics of Public Service Delivery in Africa, E. N.-M. Ayee, Ed. Oxford University Press, 2014, pp. 87-112. https://doi.org/10.1111/dpr.12066
[30] I. I. Echeme and C. C. Nwachukwu, “Impact of project funding on the implementation of LEEMP development project: A situational analysis,” International Journal of Development and Management Review, vol. 4, no. 1, pp. 197–210, 2009.
[31] K. Schwalbe, Information Technology Project Management, 4th ed. Cengage Publishing, 2008.Cengage Publishing, Boston, MA.
[32] M. M. Ogbeidi, “Political leadership and corruption in Nigeria since 1960: A socio-economic analysis,” Journal of Nigeria Studies, vol. 1, no. 2, pp. 1-25, 2012.
[33] Transparency International, “Corruption perceptions index 2019: Sub-Saharan Africa regional analysis,” Transparency International, 2019.
[34] Nigerian Institute of Quantity Surveyors, “Capacity assessment of public sector project monitoring units,” NIQS Research Report, 2018.NIQS Research Report, Lagos, Nigeria.
[35] U. E. Ene and E. P. Akpan, “Challenges of monitoring and evaluation in the Nigerian public sector,” International Journal of Development and Management Review, vol. 13, no. 1, pp. 112-128, 2018.
[36] M. Andrews, The Limits of Institutional Reform in Development: Changing Rules for Realistic Solutions. Cambridge University Press, 2013. https://doi.org/10.1017/CBO9781139060974
[37] R. A. Joseph, Democracy and Prebendal Politics in Nigeria: The Rise and Fall of the Second Republic. Cambridge University Press, 2014. Cambridge University Press, Cambridge, UK.
[38] J. W. Creswell and V. L. P. Clark, Designing and Conducting Mixed Methods Research, 3rd ed. Sage Publications, 2017.Sage Publications, Thousand Oaks, CA.
[39] T. Yamane, Statistics: An Introductory Analysis, 2nd ed. Harper and Row, 1967.Harper and Row, New York, NY.
[40] J. F. Hair, W. C. Black, B. J. Babin, and R. E. Anderson, Multivariate Data Analysis, 7th ed. Pearson Education, 2014.Pearson Education, London, UK.
[41] G. E. Nworuh, “Test for significance in multiple regression,” in Fundamentals of Applied Quantitative Techniques for Management Decision, Bon Associates, 2007. Bon Associates, Owerri, Nigeria.
[42] M. Q. Patton, Qualitative Research & Evaluation Methods: Integrating Theory and Practice, 4th ed. SAGE Publications, 2015.SAGE Publications, Thousand Oaks, CA.
[43] R. K. Yin, Case Study Research and Applications: Design and Methods, 6th ed. SAGE Publications, Thousand Oaks, CA.
[44] B. Flyvbjerg, How Big Things Get Done: The Surprising Factors Behind Every Successful Project. Oxford University Press, 2021.Oxford University Press, New York, NY.
[45] J. Cohen, Statistical Power Analysis for the Behavioral Sciences, 2nd ed. Lawrence Erlbaum Associates, 1988.Lawrence Erlbaum Associates, Hillsdale, NJ.
[46] G. Mansuri and V. Rao, Localizing Development: Does Participation Work? World Bank Policy Research Report, 2013. https://doi.org/10.1007/s00712-014-0394-4
[47] Nigerian Meteorological Agency, “Climate and infrastructure risk report: South-East Nigeria 2019-2024,” NIMET Publications, 2025.NIMET Publications, Abuja, Nigeria.
[48] O. E. Williamson, The Economic Institutions of Capitalism. Free Press, 1985.New York, NY.
[49] J. Amoah, A. B. Jibril, M. A. Odei, S. Bankuoru Egala, R. Dziwornu, and K. Kwarteng, “Deficit of digital orientation among service-based firms in an emerging economy: A resource-based view,” Cogent Business & Management, vol. 10, no. 1, 2023. https://doi.org/10.1080/23311975.2022.2152891
[50] Y. Chen, D. D. Ahiaga-Dagbui, M. J. Thaheem, and A. Shrestha, “Toward a deeper understanding of optimism bias and transport project cost overrun,” Project Management Journal, vol. 54, no. 5, pp. 561-578, 2023. https://doi.org/10.1177/87569728231180268
[51] A. Q. Adeleke and S. O. Ajayi, “Infrastructure governance in Nigeria’s rural development: Capacity constraints in monitoring and evaluation,” Journal of African Built Environment, vol. 8, no. 2, pp. 45-67, 2023. No DOI publisher/ISSN/city
[52] S. Chae, T. Y. Choi, and G. Hoetker, “Theorizing the governance of direct and indirect transactions in multi-tier supply chains,” Journal of Supply Chain Management, vol. 60, no. 2, pp. 3-21, 2024. https://doi.org/10.1111/jscm.12318
[53] I. M. Okonkwo and C. C. Nwachukwu, “Political economy of infrastructure monitoring in Nigeria’s South-East states,” African Journal of Public Administration and Governance, vol. 12, no. 3, pp. 89-108, 2024.
[54] D. Acemoglu and J. A. Robinson, Why Nations Fail: The Origins of Power, Prosperity, and Poverty. Crown Publishers, 2012. https://doi.org/10.54945/jjia.v4i1.99
[55] World Bank, World Development Report 2017: Governance and the Law. World Bank, 2017. https://doi.org/10.1596/978-1-4648-0950-7
[56] World Bank, Nigeria Development Update: Turning the Corner – From Reforms and Renewed Hope to Results. World Bank Group, 2023.World Bank Group, Washington, D.C.
[57] J. Barney, “Firm resources and sustained competitive advantage,” Journal of Management, vol. 17, no. 1, pp. 99-120, 1991.publisher: Sage, ISSN: 0149-2063, Thousand Oaks, CA.