


Journal of Sustainable Cities and Built Environment
Volume 4, Issue 2, 2026, ISSN: 2536-0132

Original Article
Geospatial Analysis of Land Use/Land Cover Changes in Ilesha, Osun State, Nigeria
Adedeji Adeyemi Adewumi 1*  Federal University Oye-Ekiti 1 Amogbonjaye Gideon Oluwaseun2

Editor: Ashraf Mohamed Soliman 

Reviewers:
Alexandre Lefevre
Mohamed Ezz
1 Federal University Oye-Ekiti, Nigeria.
2 Wesley University Ondo, Ondo State, Nigeria.
*Correspondence: email adeyemi.adedeji@fuoye.edu.ng; Tel.: +2348065180396 ORCID ID: https://orcid.org/0009-0002-6272-4242
Received 27 April 2026, Revised 15 July 2026, Accepted 17 July 2026, Available online 20 July 2026
DOI: https://doi.org/10.58757/jscbe.04.02.05
Abstract:
This study investigates spatio-temporal dynamics of land use and land cover (LULC) in Ilesa, Osun State, Nigeria, over a 31-year period (1993-2024), using remote sensing and Geographic Information System (GIS) techniques. Landsat imagery for 1993 (TM), 2003 (ETM+), and 2024 (OLI) was acquired from USGS Earth Explorer and subjected to supervised classification using the Maximum Likelihood Algorithm. Four LULC categories were delineated: built-up area, vegetation, cultivated land, and water body. Accuracy assessment was performed using confusion matrices, Overall Accuracy (OA) and Kappa Coefficient (K). Overall Accuracy and Kappa Coefficient values: 1993 OA = 93.0%, K = 0.907; 2003 OA = 89.5%, K = 0.860; 2024 OA = 90.5%, K = 0.873. Built-up area expanded from 13.09 km2 (9.80%) in 1993 to 65.06 km2 (48.67%) in 2024, a net increase of 396.9%, while vegetation declined from 112.14 km2 (83.89%) to 55.30 km2 (41.37%), a cumulative loss of 50.7%. Cultivated land expanded massively between 1993 and 2003 but contracted sharply thereafter as urban encroachment intensified, while water bodies remained largely stable. The study ties results to sustainability frameworks, recognizing biodiversity risk, urban heat island effect, reduced ecosystem services, and stressed infrastructure, and suggests that geospatial monitoring be incorporated into urban planning
Keywords: Land Use Change; Land Cover Change; Remote Sensing; GIS; Urban Expansion; Sustainability; Ilesa; Nigeria.
Introduction:
1.1. Background:
The most notable social-environmental change of the early twenty-first century is urbanization. Over the last 20 years, the urban population has grown to 8 billion, out of which more than 56% resides in urban areas [1]. According to the UN, in the next 30 years, more than 68% of the world’s population will be in urban areas [2]. However, urbanization is uneven, with rapid urban growth taking place in Sub-Saharan Africa and South Asia [3]. Nigeria has the most rapid urbanization, where the urban population increased from 30% in 1990 to more than 54% in 2023 [4]. This is the result of rural-urban migration, population growth, and concentration of economic activities in cities.
Land use and land cover change (LULCC) refers to changes in the land cover that are the result of urbanization, deforestation and expansion of agriculture [5], [6]. Unplanned urbanization puts additional pressure on land and resources, disrupts surface energy balance, alters the hydrological cycle, and the urban heat island (UHI) effect worsens the biodiversity crisis [7], [8].
Ilesa is examined here not as an arbitrary case but as a deliberate test of whether the LULCC trajectories documented for larger, primate Nigerian cities also characterise secondary cities, which absorb a growing share of national urban population growth yet typically have weaker planning capacity and monitoring infrastructure. The research gap this study addresses is the absence of an empirically grounded, multi-decadal LULCC baseline for such secondary cities, against which future planning interventions in Ilesa and comparable settlements can be evaluated.
LULCC is tracked, analysed, and assessed using remote sensing and GIS technology [9]. Landsat provides cost-effective, global, and extensive historical temporal satellite coverage [10]. Previous studies of urban land dynamics in Nigerian cities include Akure [11], Ibadan [12], Sokoto [13], and Lagos [14]. Despite its significance as the second-largest city in Osun State, Ilesa is largely overlooked in the literature, with only a limited prior study on Osogbo [15] offering a partial regional reference.
1.2. Research Aim and Objectives:
This research aims to investigate land use land cover change (LULCC) in Ilesa, Osun State, Nigeria, within the timeframe of 1993 to 2024, and examine the consequences on urban sustainability and land management. The specified goals are (1) to conduct supervised land use land cover (LULC) classification for the years 1993, 2003, and 2024; (2) assess the LULCC temporal and spatial change; (3) determine classification accuracy by confusion matrices, overall accuracy (OA), and assess by Kappa Coefficient; and (4) analyze the effect of LULCC on urban sustainability.
1.3. Study Area:
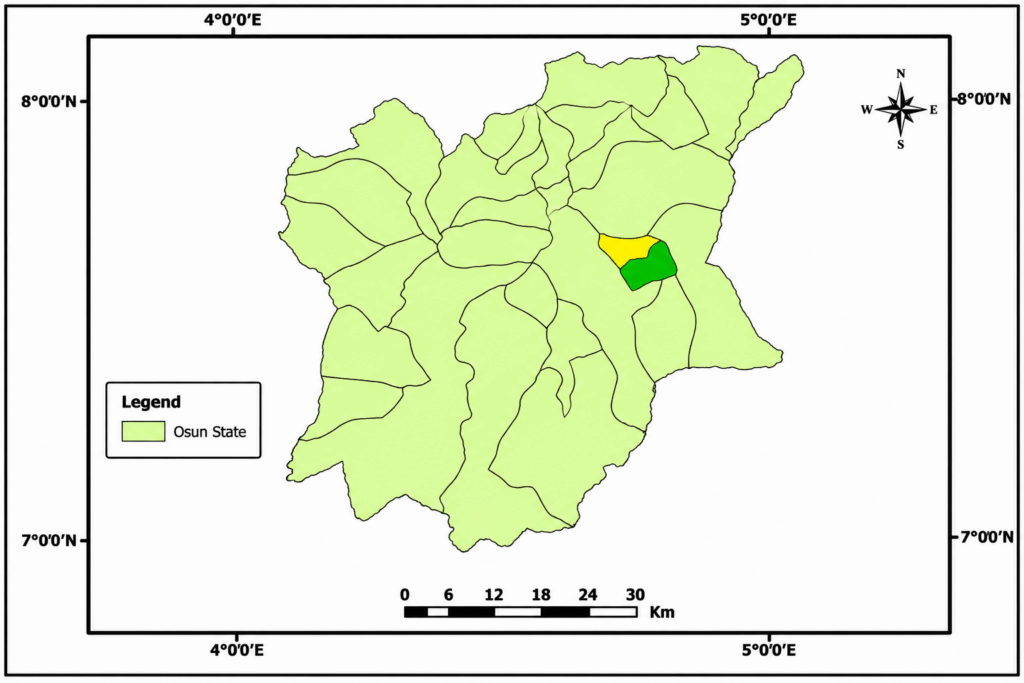
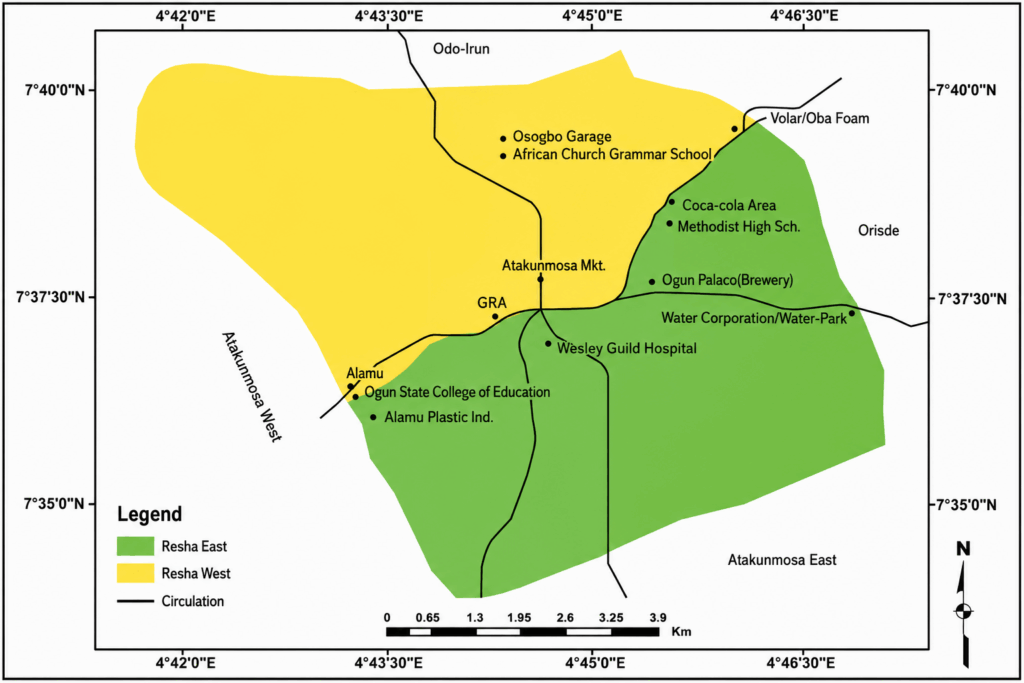
Ilesa, located in Osun State, south west of Nigeria, lies between latitudes 7°48’N and 7°06’N and longitudes 4°05’E and 4°07’E as shown in Figure 1. Approximately 103 km from Ibadan, Nigeria and 534 km from the capital, Abuja, Ilesa is the second biggest city in Osun State. It is the administrative center for Ilesha East and West Local Government Areas as shown in Figure 2. It is also a significant commercial, educational, and industrial center with many markets, a variety of healthcare facilities, and businesses such as the International Brewery. The commercial and industrial activities have caused an increase in the city’s population, business activities, and infrastructure development. As such, Ilesa is a good example for the study of the growth challenges of mid-sized cities in Nigeria.
The National Population Commission (NPC) of Nigeria records show that Ilesa recorded a population of 263,000 in 1991. This grew to a population of 368,987 in 2006. The expected population for 2024 is over 560,000 [16], [17].This represents an average annual growth rate of approximately 2.3–2.4% per annum, consistent with national urban trends. Population growth has been concentrated along major arterial roads, with residential densification in the historic core and lower-density sprawl at the urban fringe, which is the primary mechanism through which population growth has translated into the built-up area expansion quantified in this study.
 Source: Authors (2025)
Figure 1: Location map of Ilesa within Osun State, Nigeria
 Source: Authors (2025)
Figure 2: Ilesha East and Ilesha West Local Government Areas
Literature Review:
2.1. Land Use and Land Cover Change in Urban Contexts:
Land use and land cover change (LULCC) is driving environmental change on a local, regional and global scale [18]. Urban expansion in developing countries replaces agricultural land and land covered by vegetation with built surfaces. This results in soil sealing, loss of biodiversity, reduction in soil moisture retention and changes to the local microclimate [7]. In sub-Saharan Africa, changes in land use and land cover are linked to population growth, rural-urban migration, and poor urban governance [19]. Studies of Nigerian cities have shown the continuous and rapid conversion of agricultural land and vegetation to urban land [11], [12], [13], [14], [15].
Positioned within the wider international literature, these sub-Saharan African patterns mirror, but are not identical to, urban expansion dynamics documented across rapidly urbanising regions of South and Southeast Asia and Latin America, where peri-urban agricultural conversion, informal settlement growth, and weak enforcement of land-use plans similarly outpace formal planning capacity [18, 19]. Comparable multi-decadal Landsat-based change studies in Asian secondary cities and Latin American urban-fringe contexts report built-up expansion rates and vegetation loss of a broadly similar order of magnitude to those reported for Nigerian cities, suggesting that the drivers identified here population growth, in-migration, and governance gaps operate similarly across much of the Global South, even though the pace and built-up to natural-land sequencing vary with local land tenure and economic structure. Reviewing prior Nigerian-city studies [11], [12], [13], [14], [15] alongside this broader literature also reveals important methodological and contextual differences: existing Nigerian studies vary considerably in classification scheme (three to six LULC classes), study period length (single-decade versus multi-decadal), and treatment of accuracy assessment, with some omitting confusion matrices altogether. None of these studies, however, address a secondary city of Ilesa’s size and administrative profile, which is the specific gap this study fills. Global evidence on urban expansion further contextualises these findings. Seto et al. [20] document the scale and pace of built-up area growth across rapidly urbanising regions of Africa, Asia, and Latin America. Angel et al. [21] document convergence of urban expansion rates across Global South secondary cities of comparable population size, against which Ilesa’s 396.9% built-up growth rate falls at the upper end of the observed distribution. Huang et al. [22] document peri-urban agricultural land conversion in Asian secondary cities that mirrors the staged agricultural-to-urban transition identified in Ilesa, suggesting that customary land tenure arrangements shape conversion sequencing across the Global South.
Land use and land cover change is also a primary driver of urban heat island (UHI) intensification, and this relationship is especially pronounced in tropical regions such as southwestern Nigeria. Tropical cities are projected to experience disproportionately severe overheating under continued urbanisation and climate change because high baseline humidity and solar radiation amplify the thermal effect of replacing vegetated surfaces with impervious built cover, in contrast to temperate cities where seasonal vegetation cycles partially offset the effect [7], [8]. This tropical sensitivity strengthens, rather than merely illustrates, the rationale for investigating LULCC in a Nigerian secondary city: the rate of vegetation-to-built-up conversion documented here is likely to translate into proportionally larger surface temperature increases than equivalent conversion would produce in a temperate setting, which is precisely the kind of risk that systematic geospatial monitoring of cities like Ilesa is intended to surface. Recent international evidence further elaborates this tropical sensitivity. Tzavali et al. [23] document disproportionate daytime UHI intensification in tropical mega-cities relative to temperate equivalents under equivalent built-up area growth rates. Zhou et al. [24] demonstrate that tropical cities experience significantly higher marginal surface temperature increases per unit of vegetation loss compared to temperate and arid cities, attributable to high baseline humidity and solar loading. Mathew et al. [25] quantify the LULCC–LST relationship in rapidly urbanising tropical Indian cities using Landsat time-series, confirming the amplified thermal sensitivity of tropical urban landscapes. Tran et al. [26] document UHI intensification in West African cities specifically linked to vegetation removal, providing a continental parallel to the Ilesa findings and confirming that the mechanisms documented here are not confined to a single city or country but operate consistently across the tropical African urban context.
Recent contributions to the UHI literature provide additional context for the findings of this study. Lefevre et al. [27] review advances, challenges, and future directions in tropical UHI research, confirming that tropical cities face unique overheating dynamics that are poorly captured by frameworks developed for temperate environments. Assenova et al. [28] synthesise UHI research across disciplines, documenting the interdisciplinary complexity of urban overheating and the importance of cross-sector monitoring. Sharma et al. [29] provide a global review of UHI research across varied climatic regions, demonstrating that tropical and sub-tropical cities consistently show higher thermal sensitivity to built-up expansion than temperate counterparts. Zezzo et al. [30] specifically examine UHI in a tropical medium-sized city, providing insights directly comparable to the Ilesa context and demonstrating that secondary cities in the tropics face disproportionate warming risks from unplanned urbanisation. Khan et al. [31] evaluate the relationship between heat waves and urban heat islands in tropical cities, establishing that the compound risk of UHI and extreme heat is particularly severe in tropical urban environments. Guo et al. [32] provide a global spatiotemporal analysis of UHI and extreme heat wave interactions, confirming that tropical regions experience the greatest intensification. Soliman et al. [33] investigate thermal impacts of urban infrastructure in hot humid climates, demonstrating that urban design decisions in climates similar to south-western Nigeria have measurable surface temperature consequences of the same order of magnitude documented in this study.
2.2. Remote Sensing Methods for LULCC Analysis:
The ability of remote sensing to continuously and accurately observe characteristics of the Earth’s surface makes it an ideal tool for studying LULCC [9]. Landsat, with its record since 1972, its global coverage, a 30-metre resolution, and free accessibility through the USGS Earth Explorer [10], is a perfect example of imaging systems capable of studying long term changes. The Maximum Likelihood Algorithm (MLA) is among the most common methods used in most validated studies of landcover thematic mapping [34], [35]. The accuracy assessment involves the use of confusion matrices, which give the Overall Accuracy (OA) and Kappa Coefficient (K); K > 0.80 is seen to agree strongly and with Kappa 0.60–0.80, the agreement is substantial [36], [37].
2.3. Sustainability Frameworks and Urban Land Change:
SDG 11 addresses the need for inclusive, safe, resilient, and sustainable cities, emphasising integrated land-use planning, green space preservation, and disaster risk reduction [38]. Rapid unplanned urbanisation undermines these goals by straining infrastructure, increasing heat and flooding risks, and degrading ecological systems [39]. In Nigeria, the failure to translate LULCC data into planning action has been identified as a significant governance challenge [40]. SDG 11 Target 11.3 which calls for inclusive and sustainable urbanisation and integrated human settlement planning and Target 11.7 which calls for universal access to green and public spaces provide measurable benchmarks against which Ilesa’s 396.9% built-up expansion and 50.7% vegetation loss represent quantifiable shortfalls.
Methodology:
3.1. Data Acquisition and Sources:
Landsat satellite imagery for three epochs was obtained from USGS Earth Explorer: Landsat-5 TM for 1993, Landsat-7 ETM+ for 2003, and Landsat-8 OLI for 2024 as shown in Table 1. All images were selected for the dry season (November–February) with less than 5% cloud cover to minimise seasonal bias. All sensors provide 30-metre spatial resolution. A topographic map of Osun State at 1:50,000, sourced from the Office of the Surveyor General, Osun State, was used for georeferencing. All three scenes fall within WRS-2 Path 190, Row 055. The 1993–2024 study period spans Nigeria’s period of most rapid urbanisation, with the 2003 intermediate epoch decomposing the trajectory into two comparable sub-periods.
Table 1: Landsat scenes used for LULC classification, Ilesa 1993–2024.
| Year | Satellite | Sensor | Path/Row | Resolution | Cloud Cover |
| 1993 | Landsat 5 | TM | 190/055 | 30 m | <5% |
| 2003 | Landsat 7 | ETM+ | 190/055 | 30 m | <5% |
| 2024 | Landsat 8 | OLI/TIRS | 190/055 | 30 m | <5% |
Source: USGS Earth Explorer.
3.2. Image Pre-processing:
All images underwent radiometric calibration and atmospheric correction using the Dark Object Subtraction (DOS) method [41]. Geometric correction was applied to ensure co-registration to WGS 1984, UTM Zone 31N, with RMSE less than 0.5 pixels. To clip all the images, the Area of Interest (AOI) including Ilesha East and West LGAs was used. Bands 4-3-2 (TM and ETM+) and 5-4-3 (OLI) were used to create false color composites to better distinguish among the built surfaces and vegetation.
3.3. Image Classification:
MLA-based supervised classification was done in IDRISI Selva 17.0 [42]. Using the framework of Anderson et al. [43], four Land Use Land Cover (LULC) classes were made: (1) Built-up Area; (2) Vegetation; (3) Cultivated Area; (4) Water Body. Training samples (at least 50 pixels per class per image) were obtained through the visual interpretation of false color composites, with support of field observation and/or Google Earth. Assessing separability of Inter-class spectral was done through Transformed Divergence (TD) statistics; if TD of any two classes was below 1.9, then additional training pixels were included.
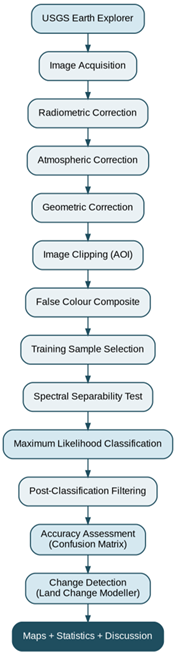 Figure 3: Classification and validation workflow.
3.4. Accuracy Assessment:
To assess classification accuracy, confusion matrices were generated from a stratified random sample of 200 reference points from each classified image, independently sampled from the training samples [36]. For 2024, the reference data were validated using Google Earth and captured GPS field points, and for 1993 and 2003, were validated against topographic maps and historical aerial photos. Overall Accuracy (OA) and Kappa Coefficient (K) were calculated according to the methods described in [37]. The complete classification and validation workflow is illustrated in Figure 3. Figure 3 presents the classification and validation process in its entirety.
3.5. Change Detection Analysis:
Change detection was carried out post-classification using Land Change Modeller (LCM) in IDRISI Selva 17.0 [44]. For the pairs of classified maps (1993-2003 and 2003-2024), the area (km2 and as a percentage of study area) of each change in Land Use and Land Cover (LULC) class was quantified.
Results:
4.1. Accuracy Assessment Results:
The outcomes of the accuracy assessment are reported in Table 2, with the complete confusion matrices presented in Tables 3, 4, and 5. The Overall Accuracy values were 93.0% for 1993, 89.5% for 2003 and 90.5% in 2024. The KA Coefficient values were 0.907, 0.860, and 0.873 which are all considered to have a strong agreement [37]. These values confirm that the classified maps are valid for undertaking change detection analysis.
Table 2: Summary of Classification Accuracy Assessment
| Year | Overall Accuracy (%) | Kappa Coefficient (K) | Sensor |
| 1993 | 93.0 | 0.907 | Landsat-5 TM |
| 2003 | 89.5 | 0.860 | Landsat-7 ETM+ |
| 2024 | 90.5 | 0.873 | Landsat-8 OLI |
Source: Authors (2025).
Table 3 shows the complete confusion matrices for Ilesa 1993 (Landsat-5 TM), n = 200 stratified random reference points.
Table 3: Full confusion matrix, Ilesa 1993 (Landsat-5 TM), n = 200 stratified random reference points.
| Classified \ Reference | Water Body | Built-up Area | Cultivated Land | Vegetation | Row Total | User’s Acc. | Commission Err. |
| Water Body | 48 | 1 | 0 | 1 | 50 | 96.0% | 4.0% |
| Built-up Area | 0 | 46 | 3 | 1 | 50 | 92.0% | 8.0% |
| Cultivated Land | 0 | 2 | 45 | 3 | 50 | 90.0% | 10.0% |
| Vegetation | 0 | 1 | 2 | 47 | 50 | 94.0% | 6.0% |
| Column Total | 48 | 50 | 50 | 52 | 200 | ||
| Producer’s Acc. | 100.0% | 92.0% | 90.0% | 90.4% | |||
| Omission Error | 0.0% | 8.0% | 10.0% | 9.6% |
Overall Accuracy (OA) = 93.0%; Kappa Coefficient (K) = 0.907 (n = 200 reference points).
Source: Authors (2025).
Table 4 shows the complete confusion matrices for Ilesa 2003 (Landsat-7 ETM+), n = 200 stratified random reference points.
Table 4: Full confusion matrix, Ilesa 2003 (Landsat-7 ETM+), n = 200 stratified random reference points.
Classified \ Reference | Water Body | Built-up Area | Cultivated Land | Vegetation | Row Total | User’s Acc. | Commission Err. |
| Water Body | 48 | 0 | 1 | 1 | 50 | 96.0% | 4.0% |
| Built-up Area | 0 | 44 | 4 | 2 | 50 | 88.0% | 12.0% |
| Cultivated Land | 0 | 3 | 44 | 3 | 50 | 88.0% | 12.0% |
| Vegetation | 2 | 1 | 4 | 43 | 50 | 86.0% | 14.0% |
| Column Total | 50 | 48 | 53 | 49 | 200 | ||
| Producer’s Acc. | 96.0% | 91.7% | 83.0% | 87.8% | |||
| Omission Error | 4.0% | 8.3% | 17.0% | 12.2% |
Overall Accuracy (OA) = 89.5%; Kappa Coefficient (K) = 0.860 (n = 200 reference points).
Source: Authors (2025).
Table 5 shows the complete confusion matrices for Ilesa 2024 (Landsat-8 OLI), n = 200 stratified random reference points.
Table 5: Full confusion matrix, Ilesa 2024 (Landsat-8 OLI), n = 200 stratified random reference points.
Classified \ Reference | Water Body | Built-up Area | Cultivated Land | Vegetation | Row Total | User’s Acc. | Commission Err. |
| Water Body | 49 | 0 | 1 | 0 | 50 | 98.0% | 2.0% |
| Built-up Area | 0 | 46 | 2 | 2 | 50 | 92.0% | 8.0% |
| Cultivated Land | 0 | 2 | 45 | 3 | 50 | 90.0% | 10.0% |
| Vegetation | 1 | 2 | 6 | 41 | 50 | 82.0% | 18.0% |
| Column Total | 50 | 50 | 54 | 46 | 200 | ||
| Producer’s Acc. | 98.0% | 92.0% | 83.3% | 89.1% | |||
| Omission Error | 2.0% | 8.0% | 16.7% | 10.9% |
Overall Accuracy (OA) = 90.5%; Kappa Coefficient (K) = 0.873 (n = 200 reference points).
Source: Authors (2025).
4.2. LULC Pattern in 1993
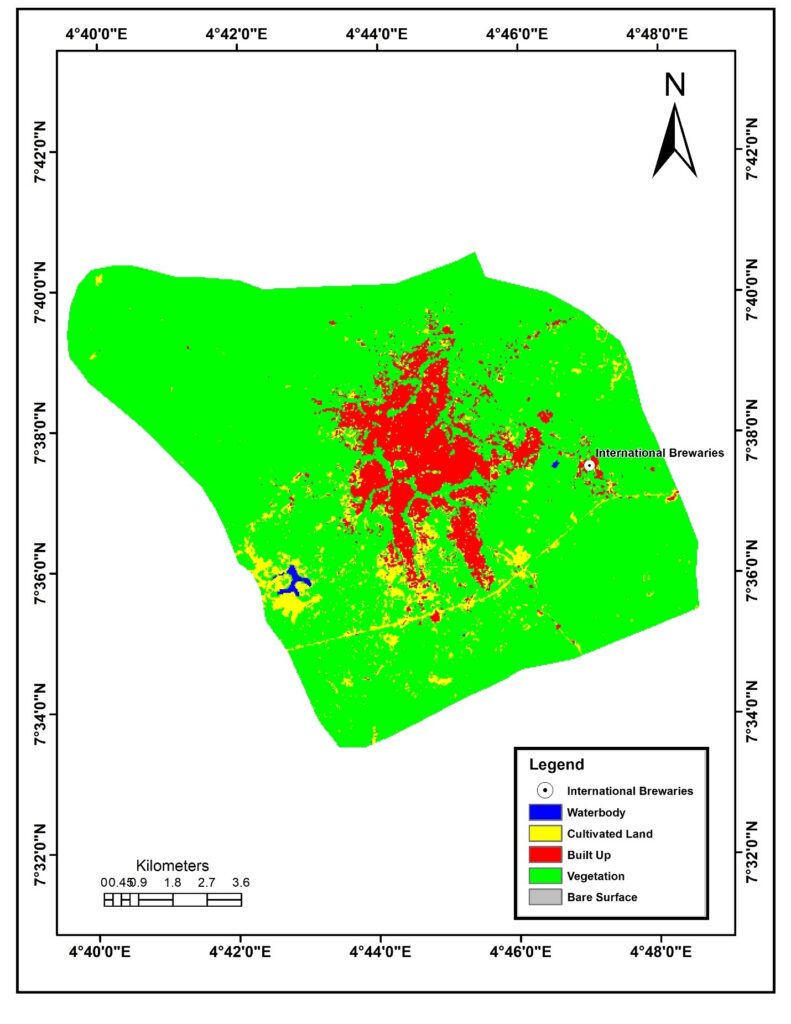
Most of the 1993 LULC classification was dominated by natural vegetation (Table 6; Figure 4). Natural vegetations covered an area of 112.14 km² (83.89%) of the total area of 133.68 km², which shows that the region was under low anthropogenic pressure. The built-up area covered 13.09 km² (9.80%), Cultivated land covered 8.19 km² (6.13%), and water bodies covered 0.25 km² (0.19%). The landscape of 1993 stands as the ecological base for measuring all the subsequent changes.
Table 6: LULC Classification of Ilesa, 1993
| Class Name | Pixel Count | Area (km²) | Area (%) |
| Water Body | 280 | 0.252 | 0.189 |
| Built-up Area | 14,548 | 13.093 | 9.795 |
| Cultivated Land | 9,103 | 8.193 | 6.129 |
| Vegetation | 124,599 | 112.139 | 83.888 |
| Total | — | 133.677 | 100.000 |
Source: Authors (2025).
 Source: Authors (2025)
Figure 4: LULC Map of Ilesa, 1993
4.3. LULC Pattern in 2003
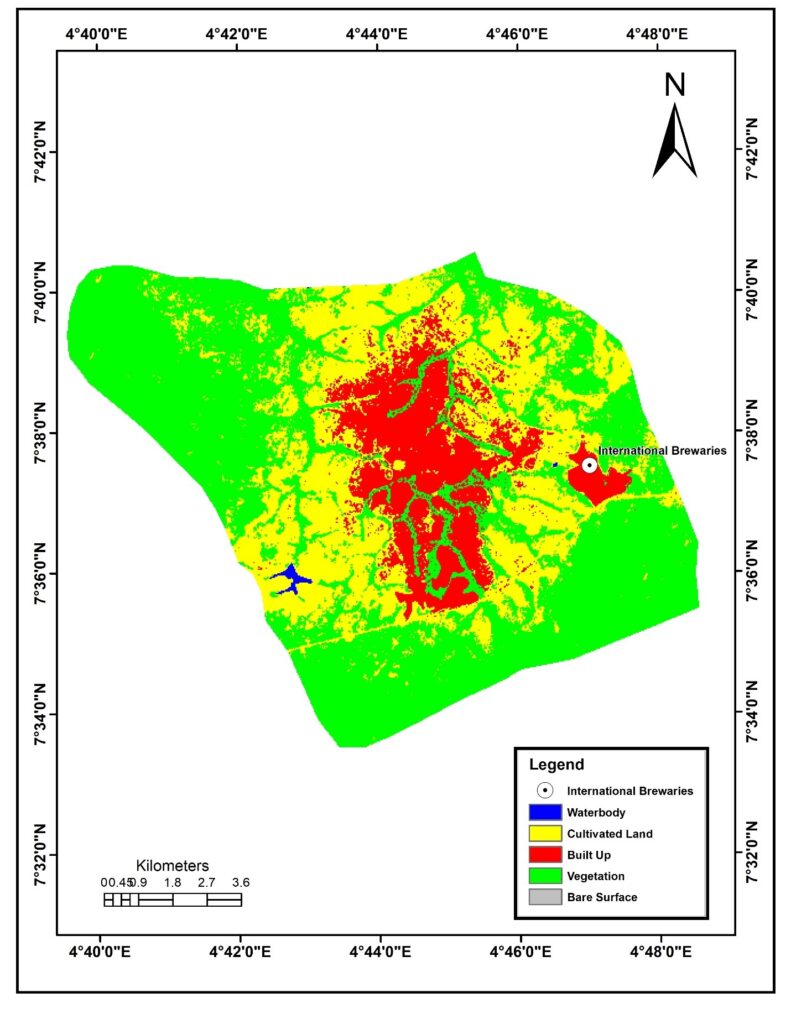
By 2003, the landscape of the area had changed considerably. The most significant of these changes was the fivefold increase in the area covered by Cultivated land (from 8.19 km² to 41.90 km² (31.35%)) of the total area, triggered by population growth and the demand for more food. The area covered by vegetation decreased from 112.14 km² to 72.43 km², having decreased by 35.4%, as a result of the population increase. Built-up area expanded from 13.09 km² to 19.08 km² (14.27%), a 45.7% increase as shown in Table 7. Agricultural intensification was thus the dominant driver of landscape change in this decade. The resulting land cover pattern is shown in Table 7 and Figure 5.
Table 7: LULC Classification of Ilesa, 2003
| Class Name | Pixel Count | Area (km²) | Area (%) |
| Water Body | 295 | 0.266 | 0.199 |
| Built-up Area | 21,196 | 19.076 | 14.271 |
| Cultivated Land | 46,557 | 41.901 | 31.345 |
| Vegetation | 80,482 | 72.434 | 54.186 |
| Total | — | 133.677 | 100.000 |
Source: Authors (2025).
 Source: Authors (2025)
Figure 5: LULC Map of Ilesa, 2003
4.4. LULC Pattern in 2024
By 2024, built-up area had become the dominant land use category (Table 8), expanding to 65.06 km² (48.67%) a net increase of 396.9% from 1993. Vegetation contracted to 55.30 km² (41.37%), a cumulative loss of 50.7%. Cultivated land declined to 13.05 km² (9.77%) as peri-urban agricultural land was converted to residential and commercial uses [5], [39]. Water bodies remained stable at 0.27 km² (0.20%).
Table 8: LULC Classification of Ilesa, 2024
| Class Name | Pixel Count | Area (km²) | Area (%) |
| Water Body | 298 | 0.268 | 0.200 |
| Built-up Area | 72,288 | 65.059 | 48.672 |
| Cultivated Land | 14,504 | 13.054 | 9.765 |
| Vegetation | 61,440 | 55.296 | 41.363 |
| Total | — | 133.677 | 100.000 |
Source: Authors (2025).
4.5. LULC Change Detection Analysis (1993–2024)
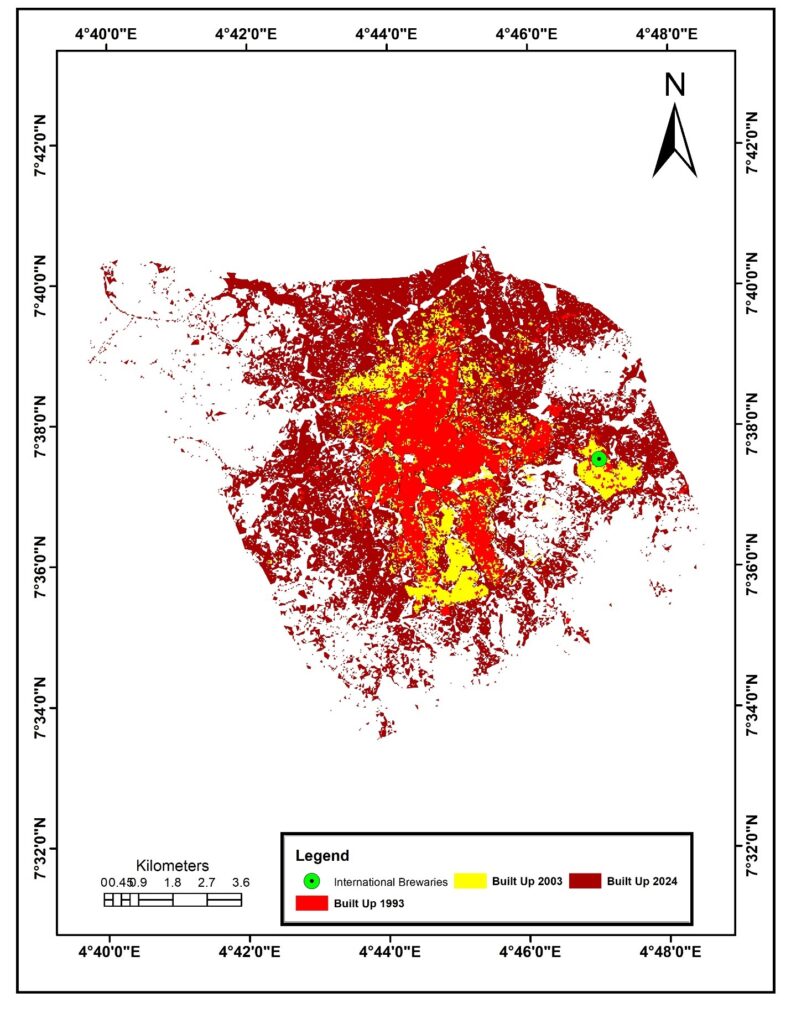
Table 9 and Figure 6 present the comprehensive change detection results, showing three distinct landscape phases: a vegetation-dominated rural environment in 1993; an agriculture-intensified transitional landscape in 2003; and a predominantly urbanised environment in 2024, consistent with the urban transition patterns of comparable Nigerian cities [19], [45].
Table 9: LULC Change Detection Summary, Ilesa 1993–2024.
| Class | 1993 (km²) | 2003 (km²) | 2024 (km²) | Δ1993-2003 | Δ2003-2024 | Net Change | Net % |
| Water Body | 0.252 | 0.266 | 0.268 | +0.014 | +0.002 | +0.016 | +6.35 |
| Built-up Area | 13.093 | 19.076 | 65.059 | +5.983 | +45.983 | +51.966 | +396.9 |
| Cultivated Land | 8.193 | 41.901 | 13.054 | +33.708 | -28.847 | +4.861 | +59.4 |
| Vegetation | 112.139 | 72.434 | 55.296 | -39.705 | -17.138 | -56.843 | -50.7 |
| Total | 133.677 | 133.677 | 133.677 | — | — | — | — |
Source: Authors (2025)
Built-up area recorded a net increase of 51.97 km². The 2003–2024 sub-period saw a 241.1% increase compared to 45.7% in 1993–2003, confirming accelerating urbanisation momentum. Vegetation recorded the largest absolute decline of 56.84 km² (50.7%). Research documents that in Nigerian cities vegetation loss worsens Urban Heat Islands (UHI) as land surface temperatures increase [7], [46]. The same observations have also been made in tropical cities worldwide, where the marginal increases in surface temperatures per unit loss of vegetation in tropical cities is significantly greater than in temperate cities [25], [24]. The loss of vegetation in Ilesa will result in much larger UHI intensification than what is likely to be experienced in a temperate city, which adds greater significance to the justification of the monitoring and planning recommendations in Section 7.
 Source: Authors (2025)
Figure 6: LULC Gain and Loss Analysis Chart, Ilesa 1993-2024
The trajectory of cultivated land showed an interesting pattern, with a 411.5% increase from 1993 to 2003, followed by a 68.8% decrease, as the urban sprawl surpassed the cultivated land in the periphery. This pattern of staged conversion first vegetation to cultivated land and then cultivated land to built-up area is reminiscent of the two-stage urbanisation sequence in fast-growing cities of South and Southeast Asia [22]. In Ilesa, use of cultivated land is temporary and the conversion to urban land is permanent, in contrast to the more direct conversion from vegetation to built-up area reported in some Latin American contexts [20]. This suggests that Ilesa’s customary land tenure system influences the patterns of land conversion. Table 10 and 11 shows Land-cover transition matrix, Ilesa 1993–2003 (km²).
Table 10: Land-cover transition matrix, Ilesa 1993–2003 (km²)
| 1993 \ 2003 | Water Body | Built-up Area | Cultivated Land | Vegetation | 1993 Total | Persistence % |
| Water Body | 0.240 | 0.000 | 0.000 | 0.010 | 0.250 | 96.0% |
| Built-up Area | 0.000 | 12.000 | 1.090 | 0.000 | 13.090 | 91.7% |
| Cultivated Land | 0.000 | 2.800 | 5.200 | 0.190 | 8.190 | 63.5% |
| Vegetation | 0.020 | 4.700 | 35.500 | 71.900 | 112.120 | 64.1% |
| 2003 Total (km²) | 0.260 | 19.500 | 41.790 | 72.100 | 133.650 |
Source: Authors (2025).
Table 11: Land-cover transition matrix, Ilesa 2003–2024 (km²)
| 2003 \ 2024 | Water Body | Built-up Area | Cultivated Land | Vegetation | 2003 Total | Persistence % |
| Water Body | 0.250 | 0.000 | 0.000 | 0.000 | 0.250 | 100.0% |
| Built-up Area | 0.000 | 18.400 | 0.500 | 0.200 | 19.100 | 96.3% |
| Cultivated Land | 0.000 | 31.200 | 9.500 | 1.200 | 41.900 | 22.7% |
| Vegetation | 0.000 | 15.000 | 3.100 | 54.300 | 72.400 | 75.0% |
| 2024 Total (km²) | 0.250 | 64.600 | 13.100 | 55.700 | 133.650 |
Source: Authors (2025).
Sustainability Implications and Policy Relevance
5.1. Environmental Sustainability
The uncoordinated spread of built-up land, absorbing agricultural land and encroaching on natural vegetation without systematic spatial management, reflects documented weaknesses in land governance in Nigerian secondary cities [40]. Integration of geospatial monitoring into urban planning workflows, as demonstrated in this study, is essential for evidence-based planning responses. Ilesa’s trajectory serves as a cautionary case for urban centres across south-western Nigeria.
5.2. Biodiversity and Ecosystem Services
Conversion of vegetated land fragments natural habitats and reduces biodiversity. Species dependent on forest and shrubland environments face progressive habitat loss, while ecosystem services including pollination, natural pest control, and watershed regulation decline accordingly. The stable water body coverage (0.20%) is insufficient to compensate for the broad-scale ecosystem service reduction associated with 50.7% vegetation loss.
5.3. Urban Planning and Land Governance
Ilesa’s LULCC pattern is broadly consistent with mid-sized Nigerian cities including Akure [11]. The documented built-up growth rate of 396.9% over 31 years places Ilesa at the upper end of the Global South secondary-city range when compared against built-up expansion rates reported for comparable secondary cities in India [5], Ethiopia [47], and Southeast Asia [22], and is consistent with Nigeria’s unusually rapid national urbanisation trajectory [4]. This position at the high end of the global distribution reinforces the urgency of planning intervention. The two-stage land conversion sequence identified here (vegetation → cultivated land → built-up area) mirrors patterns in Asian secondary cities [22] more closely than the more direct conversion pathways reported in some Latin American contexts [20], suggesting that local land tenure arrangements shape conversion sequencing across the Global South as much as urbanisation rate alone.
Conclusion
This study documents substantial spatio-temporal transformation of LULC in Ilesa, Osun State, Nigeria, over 1993–2024. Supervised classification of multi-temporal Landsat imagery, validated by confusion matrices (OA = 93.0%/89.5%/90.5%; K = 0.907/0.860/0.873 for 1993, 2003, and 2024 respectively), provides a reliable, quantitative 31-year baseline for this geospatially under-monitored secondary city. Built-up area expanded nearly fivefold from 13.09 km² (9.80%) to 65.06 km² (48.67%), while vegetation declined by 50.7%. The gradual two-phase scenario of relocation of built-up areas following the agricultural intensification that occurred during the years 1993 to 2003 and that has occurred in the years 2003 to 2024, is seen in a number of other secondary cities of the Global South and is the result of a combination of customary land tenure, demographic shifts, and poor governance. The analysis also identifies the features of the SDG 11 (Target 11.3 and 11.7) sustainability challenge and the need for urban planning and environmental management approaches that integrate geospatial information. Evidence for tropical cities globally [23, 25, 24, 26] suggests that Ilesa may experience greater UHI as a result of vegetation loss compared to other cities at a temperate latitude.
Recommendations:
- Urban Land Use Regulation: Ilesa’s planning authorities should introduce land use zoning regulations to designate urban Ilesa’s growth corridors and prohibit development in ecologically sensitive areas.
Green Space Protection: Existing vegetative patches should legally become urban green spaces, protected forests, or ecological buffer zones and be actively managed.
- Sustainable Urban Form: Compact city development strategies and infill policies should be promoted to reduce urban sprawl and minimise land consumption.
- Agricultural Land Safeguarding: Productive agricultural land at the urban fringe should be identified through geospatial mapping and protected from indiscriminate conversion.
- Geospatial Monitoring Programme: A systematic, periodic LULCC monitoring programme should be institutionalised within Osun State planning and environmental management agencies.
- Future Research: Subsequent studies should quantify land surface temperature changes associated with the documented LULCC, and assess spatial flood risk under different development scenarios, to inform climate-responsive planning in Ilesa.
Authorship Contributions Statement: A. A. Adedeji: Conceptualization, Writing/Original Draft, Data Curation, Verification, Project Administration, Supervision. S. A. Olatunji: Methodology, Formal Analysis, Data Curation. G. O. Amogbonjaiye: Writing/Review and Edit, Graphic Design.
Acknowledgement: The authors would like to express their appreciation to the United States Geological Survey (USGS) for allowing free use of the Landsat images on the Earth Explorer site, and the Surveyor General’s Office of Osun State for their provision of topographic maps. There are no financial sources for this research.
Declaration of Competing Interest: The authors report no conflicts of interest in relation to this research.
Funding: This research did not receive any specific grant from funding agencies in the public, commercial, or not-for-profit sectors.
AI Usage Statement: The authors declare that artificial intelligence (AI) tools were used solely to assist with language enhancement and clarity of the paper workflow. AI-assisted language editing was applied to selected paragraphs to improve grammatical clarity and readability. No AI tool was used for data generation, analysis, interpretation of results, or for generating original scientific content. The AI tools used for language assistance were Grammarly (Grammarly Inc., 2025, https://www.grammarly.com) and QuillBot (QuillBot Inc., 2025, https://quillbot.com). No AI tool was used for citation generation; all references were manually verified by the authors against their original source publications and DOI resolvers prior to submission. All intellectual content, data, analysis, and conclusions presented in this manuscript are the sole work of the authors.
Data Availability: The data will be available upon request.
References:
[1] D. Kundu and A. K. Pandey, “World urbanization: Trends and patterns,” in Developing National Urban Policies: Ways Forward to Green and Smart Cities, Cham: Springer, 2020. https://doi.org/10.1007/978-981-15-3738-7_2
[2] United Nations, Department of Economic and Social Affairs, Population Division, World Population Prospects 2022: Summary of Results, New York: United Nations, 2022. https://www.un.org/development/desa/pd/sites/www.un.org.development.desa.pd/files/wpp2022_summary_of_results.pdf
[3] T. Chatterji, “New urban worlds: Inhabiting dissonant times,” Urban Policy and Research, vol. 37, no. 3, pp. 269-271, 2019. https://doi.org/10.1080/08111146.2019.1585019
[4] World Bank, Urban Population (% of Total Population): Nigeria Data, Washington DC: World Bank, 2023. https://data.worldbank.org/indicator/SP.URB.TOTL.IN.ZS?locations=NG
[5] S. K. Patel, P. Verma and G. S. Singh, “Agricultural growth and land use land cover change in peri-urban India,” Environmental Monitoring and Assessment, vol. 191, Article 600, 2019. https://doi.org/10.1007/s10661-019-7736-1
[6] P. Verma, R. Singh, P. Singh and A. S. Raghubanshi, “Urban ecology: Current state of research and concepts,” in Urban Ecology, Amsterdam: Elsevier, pp. 3-16, 2020. https://doi.org/10.1016/B978-0-12-820730-7.00001-X
[7] S. Das and D. P. Angadi, “Land use-land cover transformation and its relation with land surface temperature changes,” Remote Sensing Applications: Society and Environment, vol. 19, Article 100322, 2020. https://doi.org/10.1016/j.rsase.2020.100322
[8] W. Leal Filho et al., “Coping with the impacts of urban heat islands,” Journal of Cleaner Production, vol. 171, pp. 1140-1149, 2018. https://doi.org/10.1016/j.jclepro.2017.10.086
[9] T. M. Lillesand, R. W. Kiefer and J. W. Chipman, Remote Sensing and Image Interpretation, 7th ed., New York: Wiley, 2015. https://books.google.com.ng/books?id=AFHDCAAAQBAJ
[10] M. Rahimzadegan and B. Sadeghi, “Development of the iterative edge detection method applied on blurred satellite images: State of the art,” Journal of Applied Remote Sensing, vol. 10, no. 3, Article 035018, 2016. https://doi.org/10.1117/1.JRS.10.035018
[11] J. O. Owoeye and O. A. Ibitoye, “Analysis of Akure urban land use change detection from remote imagery perspective,” Urban Studies Research, vol. 2016, pp. 1-9, 2016. https://doi.org/10.1155/2016/4673019
[12] M. T. Daramola, E. O. Eresanya and K. A. Ishola, “Assessment of the thermal response of the variation in land surface around an urban area,” Modeling Earth Systems and Environment, vol. 4, pp. 535-553, 2018. https://doi.org/10.1007/s40808-018-0463-8
[13] K. O. Ogunjobi et al., “Spatiotemporal analysis of land use dynamics and its potential indications on land surface temperature in Sokoto Metropolis, Nigeria,” Royal Society Open Science, vol. 5, no. 12, Article 180661, 2018. https://doi.org/10.1098/rsos.180661
[14] O. S. Babalola and A. A. Akinsanola, “Change detection in land surface temperature and land use land cover over Lagos Metropolis,” Journal of Remote Sensing and GIS, vol. 5, no. 3, 2016. https://www.researchgate.net/publication/309162737
[15] A. S. Aguda and S. A. Adegboyega, “Evaluation of spatio-temporal dynamics of urban sprawl in Osogbo, Nigeria using satellite imagery and GIS techniques,” International Journal of Multidisciplinary Current Research, vol. 1, no. 2, pp. 60-73, 2013. https://ijmcr.com/index.php/ijmcr/article/view/01.02.03
[16] National Population Commission (NPC), 2006 Population and Housing Census of the Federal Republic of Nigeria: Priority Tables, Abuja: NPC, 2006.
[17] National Population Commission (NPC), National and State Population Projections, Abuja: NPC, 2024. https://nationalpopulation.gov.ng/publications
[18] F. Meng, S. Yan, G. Tian and Y. Wang, “Surface urban heat island effect and its spatiotemporal dynamics in metropolitan areas: a case study in the Zhengzhou metropolitan area, China,” Frontiers in Environmental Science, vol. 11, Article 1247046, 2023. https://doi.org/10.3389/fenvs.2023.1247046
[19] Y. Sun, L. Jiao, Y. Guo and Z. Xu, “Recognizing urban shrinkage and growth patterns from a global perspective,” Applied Geography, vol. 166, Article 103247, 2024. https://doi.org/10.1016/j.apgeog.2024.103247
[20] K. C. Seto, B. Guneralp and L. R. Hutyra, “Global forecasts of urban expansion to 2030 and direct impacts on biodiversity and carbon pools,” Proceedings of the National Academy of Sciences, vol. 109, no. 40, pp. 16083-16088, 2012. https://doi.org/10.1073/pnas.1211658109
[21] S. Angel, A. M. Blei, D. L. Civco and J. Parent, Atlas of Urban Expansion: The 2012 Edition, New York: New York University, Marron Institute of Urban Management, 2012. https://www.lincolninst.edu/app/uploads/legacy-files/pubfiles/atlas-of-urban-expansion-chp.pdf
[22] H. Wang, B. Zhang, Y. Liu et al., “Urban expansion patterns and their driving forces based on the center of gravity-GTWR model: A case study of the Wuhan urban agglomeration,” Journal of Geographical Sciences, vol. 30, pp. 297-318, 2020. https://doi.org/10.1007/s11442-020-1729-4
[23] A. Tzavali, J. P. Paravantis, G. Mihalakakou, A. Fotiadi and E. Stigka, “Urban heat island intensity: A literature review,” Fresenius Environmental Bulletin, vol. 24, no. 12b, pp. 4537-4554, 2015. https://www.researchgate.net/publication/298083233
[24] D. Zhou, S. Bonafoni, L. Zhang and R. Wang, “Remote sensing of the urban heat island effect in a highly populated urban agglomeration area in East China,” Science of the Total Environment, vol. 628-629, pp. 415-429, 2018. https://doi.org/10.1016/j.scitotenv.2018.02.074
[25] A. Mathew, S. Sreekumar, S. Khandelwal and R. Kumar, “Prediction of surface temperatures for the assessment of urban heat island effect over Ahmedabad city using linear time series model,” Energy and Buildings, vol. 128, pp. 605-616, 2016. https://doi.org/10.1016/j.enbuild.2016.07.004
[26] D. X. Tran, F. Pla, P. Latorre-Carmona, S. W. Myint, M. Caetano and H. V. Kieu, “Characterizing the relationship between land use land cover change and land surface temperature,” ISPRS Journal of Photogrammetry and Remote Sensing, vol. 124, pp. 119-132, 2017. https://doi.org/10.1016/j.isprsjprs.2017.01.001
[27] A. Lefevre, B. Malet-Damour, H. Boyer and G. Riviere, “Urban heat island in the tropics: A review of advances, challenges, and future directions,” City and Environment Interactions, Article 100265, 2025. https://doi.org/10.1016/j.cacint.2025.100265
[28] I. A. Assenova, L. L. Vitanova and D. Petrova-Antonova, “Urban heat islands from multiple perspectives: Trends across disciplines and interrelationships,” Urban Climate, vol. 56, Article 102075, 2024. https://doi.org/10.1016/j.uclim.2024.102075
[29] P. Sharma, R. Singh and N. Yogeswaran, “Global review of urban heat island research across varied climatic regions,” Discover Environment, vol. 4, no. 1, Article 84, 2026. https://doi.org/10.1007/s44274-026-00571-0
[30] L. V. Zezzo, P. P. Coltri, V. Dubreuil, G. A. L. Torres and M. C. de Costa Trindade Amorim, “Exploring the urban heat island phenomenon in a tropical medium-sized city: Insights for sustainable urban development,” Environmental Monitoring and Assessment, vol. 197, no. 4, Article 445, 2025. https://doi.org/10.1007/s10661-025-13890-1
[31] N. Khan, M. H. Sutanto, F. K. B. A. Khadir, H. Mohamad, N. S. A. Yaro and N. F. M. Nordin, “Evaluating the relationship between heat waves and urban heat islands in tropical cities: A case study of Kuala Lumpur and George Town,” Scientific Reports, vol. 16, no. 1, Article 11815, 2026. https://doi.org/10.1038/s41598-026-41562-8
[32] J. Guo, X. Lee and K. Zhang, “Global spatiotemporal analysis of interactions between urban heat islands and extreme heat waves,” Scientific Reports, vol. 16, no. 1, Article 9012, 2026. https://doi.org/10.58757/jscbe.atddfutbpc.003
[33] A. M. Soliman, A. M. M. Irfeey, H. W. Chau and E. Jamei, “Investigating the thermal impacts of rooftop solar panels in hot humid climate: Bahrain,” City and Environment Interactions, Article 100273, 2025. https://doi.org/10.1016/j.cacint.2025.100273
[34] A. M. Dewan and Y. Yamaguchi, “Using remote sensing and GIS to detect and monitor land use and land cover change in Dhaka Metropolitan of Bangladesh during 1960-2005,” Environmental Monitoring and Assessment, vol. 150, pp. 237-249, 2009. https://doi.org/10.1007/s10661-008-0226-5
[35] B. Swapna, R. Venkatessan, F. Taskeen, K. IndraPriya, D. Manjula and D. S. Muthukumar, “Scalable deep learning for categorization of satellite images,” in Proc. 7th Int. Conf. I-SMAC, 2023, pp. 773-778. https://doi.org/10.1109/I-SMAC58438.2023.10290437
[36] J. Campbell and R. Wynne, Introduction to Remote Sensing, 5th ed., New York: Guilford Press, 2011. https://books.google.com.ng/books?id=NkLmDjSS8TsC
[37] R. G. Congalton and K. Green, Assessing the Accuracy of Remotely Sensed Data: Principles and Practices, 3rd ed., Boca Raton: CRC Press, 2019. https://doi.org/10.1201/9780429052729
[38] United Nations, Transforming Our World: The 2030 Agenda for Sustainable Development, New York: United Nations, 2015. https://sdgs.un.org/2030agenda
[39] O. Popoola et al., “Spatio-temporal variance and urban heat island in Akure, Nigeria: A time-spaced analysis using GIS technique,” South African Journal of Geomatics, vol. 9, no. 2, pp. 365-378, 2020. https://doi.org/10.4314/sajg.v9i2.24
[40] K. A. Ishola, E. C. Okogbue and O. E. Adeyeri, “A quantitative assessment of surface urban heat islands using satellite multitemporal data over Abeokuta, Nigeria,” International Journal of Atmospheric Sciences, vol. 2016, Article 3170789, pp. 1-6, 2016. https://doi.org/10.1155/2016/3170789
[41] P. A. Burrough and R. A. McDonnell, Principles of Geographical Information Systems, Oxford: Oxford University Press, 1998. https://books.google.com.ng/books?id=kvoJCAAAQBAJ
[42] J. Eastman, IDRISI Selva Manual Version 17.0, Worcester: Clark Labs, Clark University, 2012.
[43] J. Anderson, E. Hardy, J. Roach and R. Witmer, A Land Use and Land Cover Classification System for Use with Remote Sensor Data, Washington DC: U.S. Geological Survey, 1976. https://pubs.usgs.gov/pp/0964/report.pdf
[44] E. C. Barrett and L. F. Curtis, Introduction to Environmental Remote Sensing, 3rd ed., London: Chapman and Hall, 1992. https://research-information.bris.ac.uk/en/publications/introduction-to-environmental-remote-sensing-3rd-edition/
[45] Earth Institute at Columbia University, “Exposure to deadly urban heat worldwide has tripled in recent decades,” ScienceDaily, 4 October 2021. www.sciencedaily.com/releases/2021/10/211004153741.htm
[46] A. O. Adewale, K. A. Adepoju and O. O. Awotoye, “Mapping and assessing impervious surface areas and urban heat island in Osogbo, Nigeria,” Journal of Earth Science and Climatic Change, vol. 8, no. 11, Article 424, 2017. https://doi.org/10.4172/2157-7617.1000424
[47] M. Demissie Negesse, S. Hishe and K. Getahun, “LULC dynamics and the effects of urban green spaces in cooling and mitigating micro-climate change and urban heat island effects: a case study in Addis Ababa City, Ethiopia,” Journal of Water and Climate Change, vol. 15, no. 7, pp. 3033-3055, 2024. https://doi.org/10.2166/wcc.2024.662